















































Brandt’s Bitcoin “Inverse Head and Shoulders” Pattern: Bull Run or Head Fake?
Bitcoin climbed above $64,000 after US CPI and PPI reports came in softer than expected. That gave the rally fresh fuel. At roughly the same time, Peter Brandt’s chart flagged a possible “inverse head and shoulders” pattern forming in Bitcoin’s price. My take: the timing is compelling, but the chart is unfinished.

The move past $64,000 handed crypto traders a real macro catalyst. Both the Consumer Price Index (CPI) and Producer Price Index (PPI) were weaker than forecasts, encouraging bets that monetary policy could ease. Why does that matter? Because lower rates tend to make riskier assets such as Bitcoin more appealing. Most market recaps stop there. That’s only half right. Long-term holders and newer buyers were reportedly taking profits, which could explain why the rally lost steam.
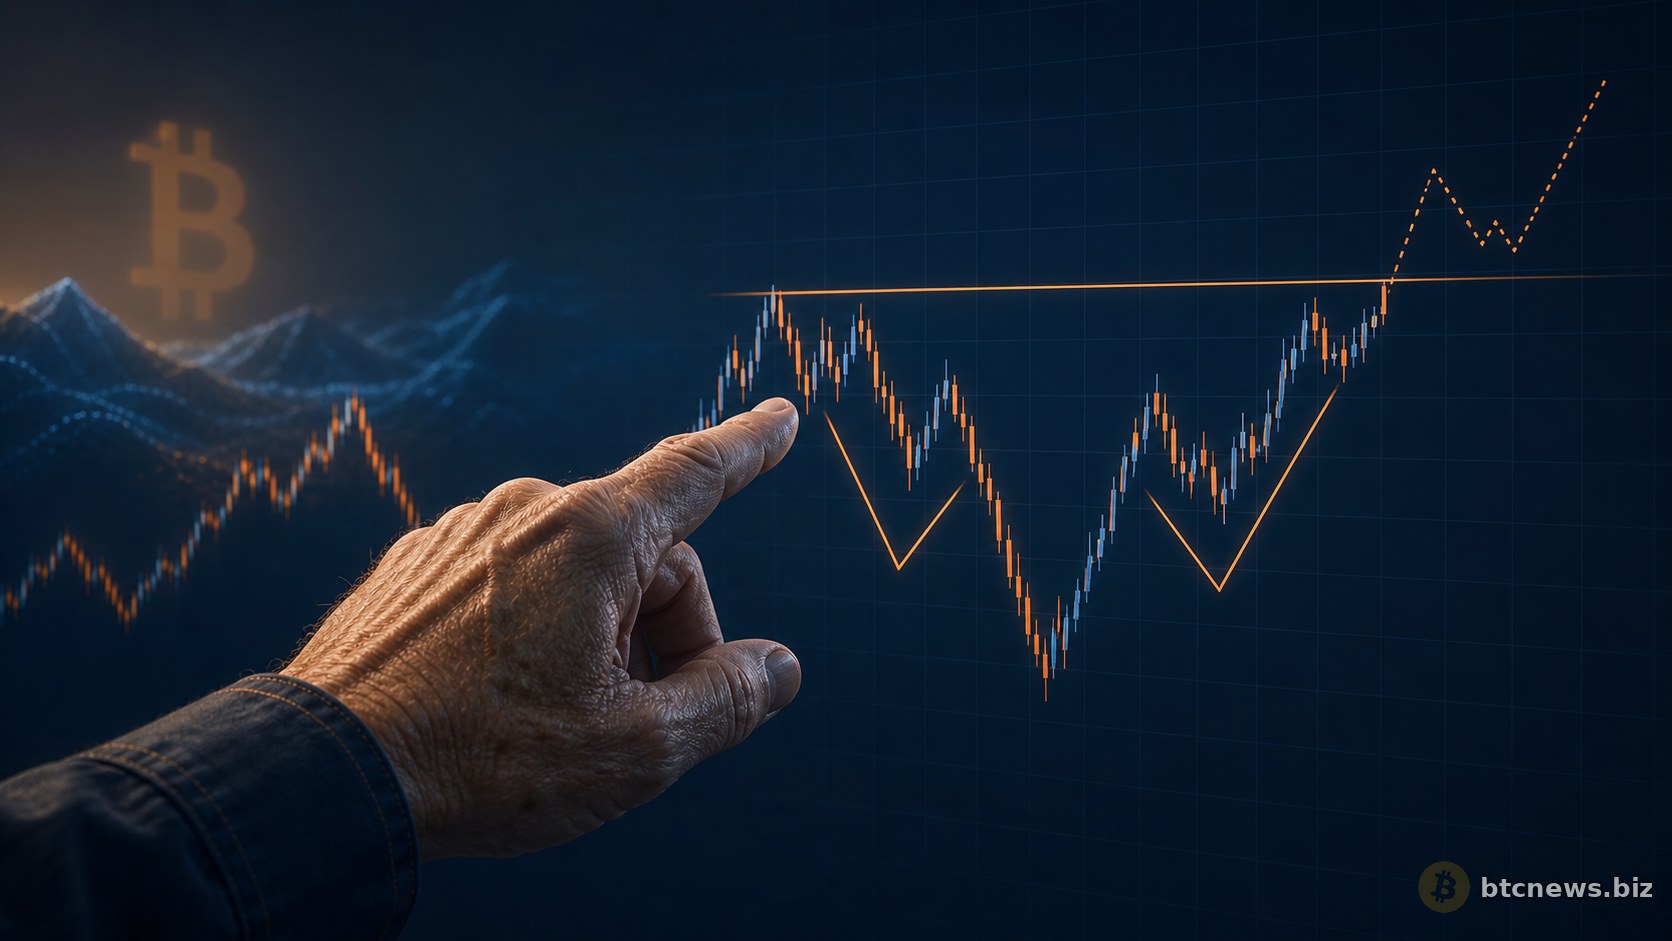
Then Peter Brandt weighed in. The commodity and crypto analyst posted a chart on X showing what he thinks could develop into an “inverse head and shoulders” bottom, a formation traders often read as evidence that a decline may be reversing. Brandt called this setup “very, very unusual.” He also admitted that it was not confirmed. I’ll be honest: that caveat matters more than the pattern’s dramatic name. Charts can look perfect. Markets still wreck them.
Brandt’s idea needs two things: a right shoulder, followed by a break above the pattern’s resistance line. Bitcoin has done neither. Nothing is confirmed yet. The weaker inflation data gives the move above $64,000 a reasonable fundamental explanation, since slower price growth can strengthen expectations of rate cuts and draw money into risk assets. Counter to the usual bullish reading, however, profit-taking by recent buyers and long-term holders suggests plenty of investors remain unconvinced. One camp expects another leg higher. The other is using the bounce to leave.
Can Bitcoin hold the recovery and finish the pattern? That is now the practical question. A confirmed breakout could convince institutional investors that the market has found a bottom; a failed setup could send Bitcoin lower even with inflation moving in a friendlier direction. To my eye, the tension is unusually clean: economic data supports risk-taking, while investor behavior shows profits being locked in. Technical charts and macro signals often disagree. Neither promises what comes next. Above $64,000, Bitcoin sits between those two forces.
What this means
If Bitcoin completes the “inverse head and shoulders” pattern, traders will probably read it as a sign that the recent slide is losing momentum. Buyers may be taking control again. That is the bullish case.
A completed pattern could turn the market structure bullish and put higher price targets in play. First, though, Bitcoin has to form a bottom traders actually believe. Its behavior around $64,000 following the CPI and PPI releases provides the immediate test. Is that single level decisive? No, but losing it would weaken the argument quickly. The profit-taking makes the picture messier: some investors are buying the dip, while others are cashing out into the bounce. Until one side takes charge, the trend remains anybody’s guess.
The neckline resistance is the level to watch. A decisive move above it would confirm the pattern, particularly if volume picks up at the same time. Staying above $64,000 would help, though it would not answer every question by itself. Yes, that sounds cautious after laying out the bullish case. It should. If Bitcoin surrenders the rally and breaks nearby support, Brandt’s setup is likely finished. One half-built chart is not enough for me to call a bull run.
The next few weeks may show whether Bitcoin is starting another sustained climb or merely bouncing inside a broad consolidation range. New economic reports could change the setup fast. Another inflation reading might alter rate expectations; an employment report could do the same, drawing money into risk assets or sending it elsewhere. The macro backdrop comes first. Brandt’s chart deserves attention, but—my view—the market still has to finish drawing it.