


Uniswap has recently announced the debut of candlestick charts on its network, further enhancing its services for users. This new feature allows individuals to make more informed financial decisions by visualizing the trading activity of assets. The candlestick charts display key information such as opening and closing prices, as well as the highest and lowest prices reached. This data enables investors to track price movements in both the short and long term, aiding them in determining whether to invest in or divest from an asset. Candlestick charts have been utilized across the crypto industry to keep users aware of token and asset price fluctuations. Uniswap had previously expressed its intention to integrate this functionality into its system, and it has now officially gone live. UniswapLabs announced the arrival of live candlestick charts on its official Twitter account, providing users with step-by-step instructions on how to access and utilize the feature. By utilizing the candlestick charts, individuals will be able to monitor real-time price action and identify trading patterns, thereby enhancing their financial success. Uniswap has also hinted at additional new products designed to help users make smarter trading decisions. Interested customers can visit the Uniswap website or wallet app to explore this new feature. With the introduction of live candlestick charts, Uniswap aims to provide its users with a comprehensive toolset to optimize their trading strategies.
Latest
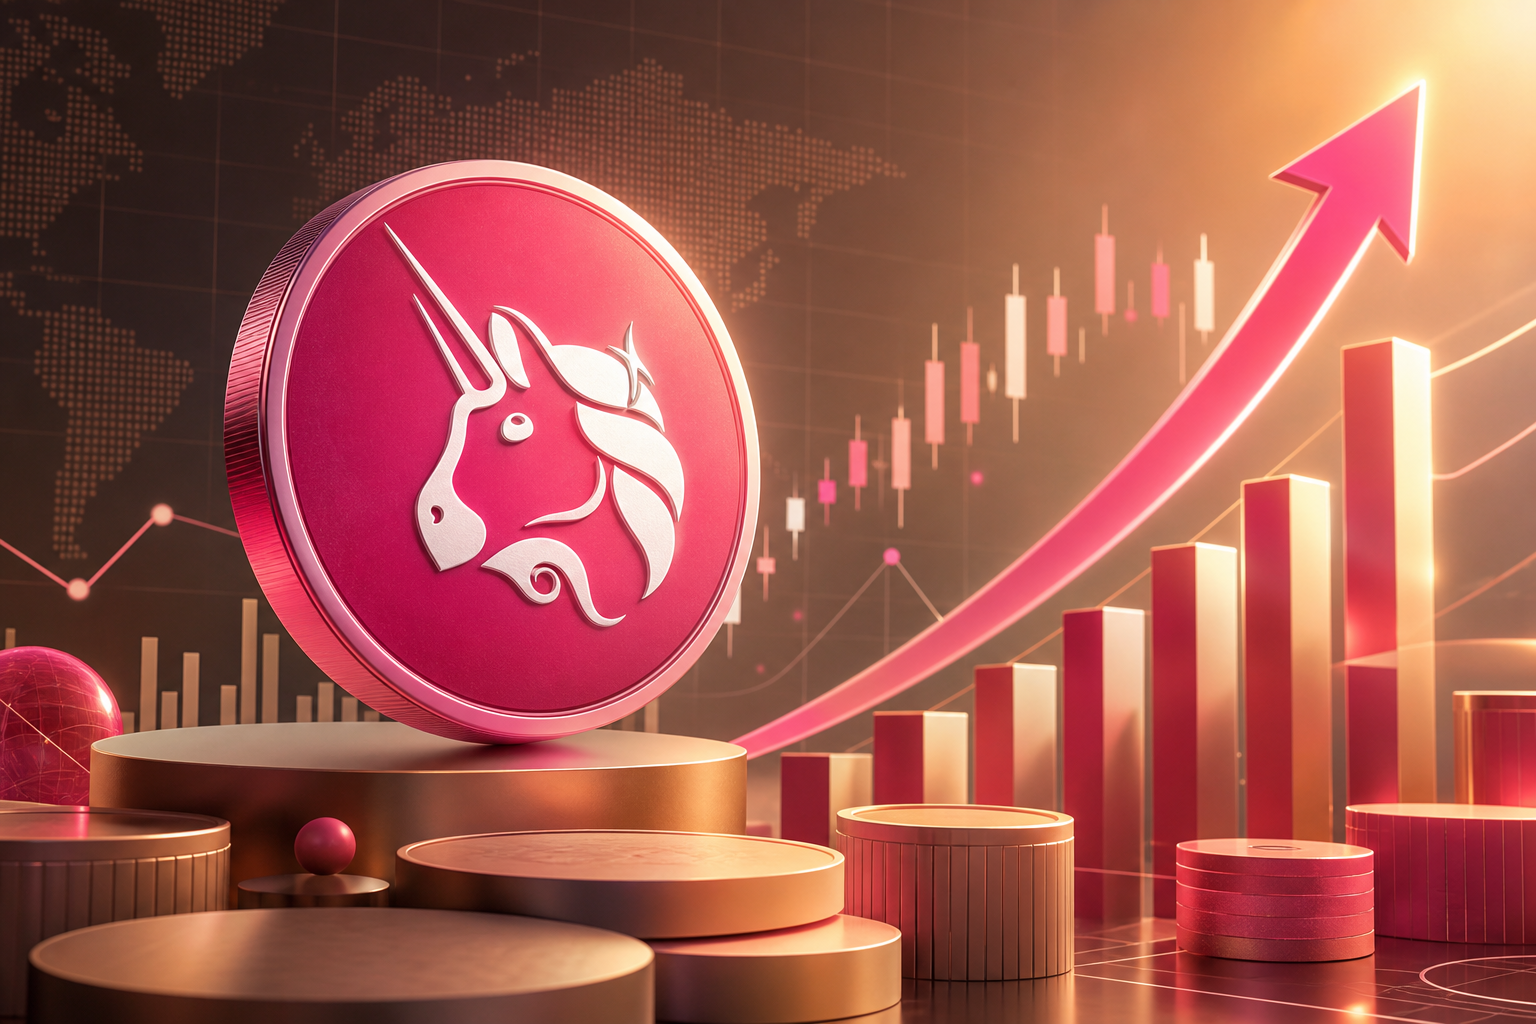
Uniswap has announced that Candlestick charts have gone live on the network

By
Henrik Lindqvist — Staff Reporter
About the author · Staff Reporter
Henrik Lindqvist
Henrik Lindqvist is our DeFi and on-chain reporter, splitting his time between Stockholm and London. A former software engineer at Klarna, he switched to journalism in 2021 and has since broken stories on MEV exploits, restaking risks and Layer-2 economics. Henrik writes the BTCNews weekly Layer-2 newsletter and has lectured on blockchain architecture at KTH Royal Institute of Technology.