
















































Bitcoin ETF Gold ETF Comparison: A Familiar Cycle Emerges
Bitcoin ETFs have hit a rough patch. IBIT briefly crossed $100 billion in assets under management, then slipped when the market turned. Bloomberg Senior ETF Analyst Eric Balchunas sees an echo of what gold ETFs went through more than a decade ago. Most accounts frame new investment products as a clean march from launch to adoption. That is only half right. Money and attention often flood in early; then the buzz dies down. My take: crypto investors may already be in that slower phase.
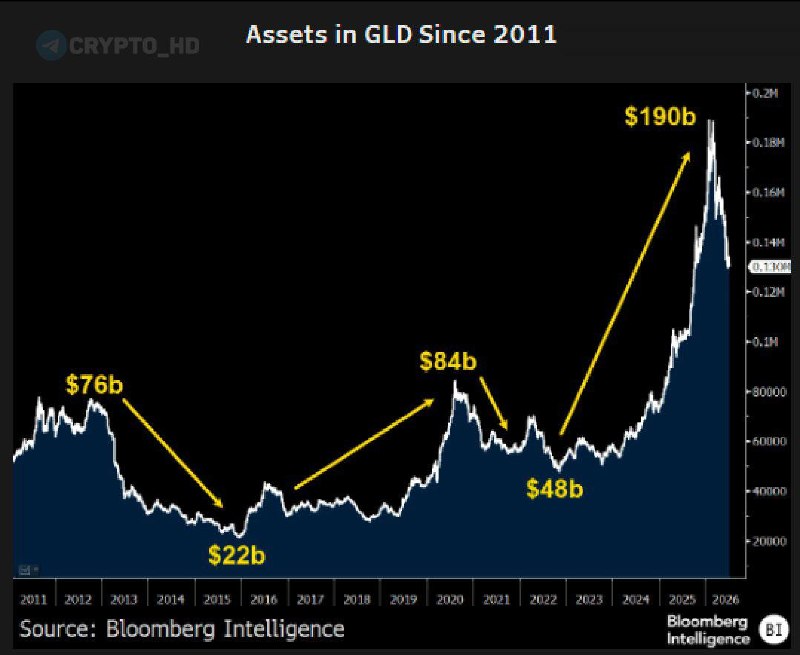
Start with 2011. That was the year the gold ETF GLD briefly became the world’s largest ETF, before a correction dragged on for years. IBIT’s sprint past $100 billion—and the downturn that followed almost immediately—looks uncomfortably familiar. History does not follow a stopwatch. Still, Balchunas has a fair point: demand moves in waves, and a steep rally can turn into years of barely visible progress. There is one reassuring detail. Every gold ETF cycle eventually produced a new all-time high.
Why does this matter beyond IBIT? Because ETF flows helped fuel Bitcoin’s wider rally. After spot Bitcoin ETFs launched, BTC climbed from below $40,000 in January to more than $73,000 in March. Institutional and retail buyers both poured in. Then the initial rush faded while the Federal Reserve maintained its hawkish position on interest rates. The cooldown was hardly shocking. I’ll be honest: the speed of the earlier move was more surprising.
I would not automatically call that bearish for Bitcoin over the long run. Counter to the usual advice, maturity does not always look like steady upward progress; sometimes it looks like a chart doing almost nothing for months. Not exactly thrilling. The immediate test is whether BTC can hold near $60,000 while economic pressure remains. If it stays below that level, Bitcoin could enter an extended stretch of flat or declining prices resembling the correction after GLD’s 2011 peak.
The gold comparison also forces a reality check on Bitcoin’s safe-haven claim. Investors have bought gold during wars and economic uncertainty for generations. Bitcoin is routinely called “digital gold,” yet its record during recent crises has been inconsistent. Take February 2022: when Russia invaded Ukraine, BTC fell from about $44,000 to $34,000 within days before recovering some of the loss. Gold rose more steadily during a comparable period. That gap matters.
Geopolitical tension and stubborn inflation are testing Bitcoin again. If Balchunas is right that demand arrives in waves, uncertainty will not necessarily send BTC higher straight away. Investors may accumulate it slowly before the next peak. Yes, that sounds less exciting than the usual breakout narrative. It probably is. But markets spend far more time waiting than setting records. I keep coming back to Bitcoin’s reaction to major world events: if it repeatedly fails to protect investors when traditional markets sell off, the “digital gold” label becomes difficult to defend. Institutions may grow more reluctant to buy as well.
What this means
The Bitcoin-versus-gold ETF comparison points to a maturing digital asset market. That does not mean smooth growth. Bitcoin may jump in short bursts and then spend months or years consolidating instead of climbing without interruption.
The first round of spot ETF buying was enormous, and institutions are clearly entering the market. But adoption does not guarantee constant gains. Most bullish guides blur that distinction. Corrections come with the territory, so crypto investors may need to abandon hopes of another immediate parabolic rally and prepare for a cycle measured in months or years. IBIT and the other spot Bitcoin ETFs offer a direct gauge of institutional demand. Continued outflows would make a deeper BTC correction more likely.
Three reference points stand out, though they do different jobs. Federal Reserve FOMC meetings could alter interest-rate expectations and change how much capital moves into risk assets such as Bitcoin. On the chart, $60,000 is the main support level; a sustained move below it could bring further losses. A recovery above $65,000 would indicate that buyers are returning. Is that overly simplistic? As a complete market model, yes—but as a near-term checklist, it is useful.
ETF data may provide the earliest signal. Daily trading volume matters. So do net flows for IBIT and the other large Bitcoin funds, since they reveal whether institutions are still buying or quietly leaving. The CME Bitcoin futures expiry on June 28 is another possible pressure point because these expiries often produce more volatility. A few rough trading days would not be unusual. In my view, that alone would prove very little. If the gold ETF precedent holds, the turbulence may be another stage in the cycle rather than its end.