


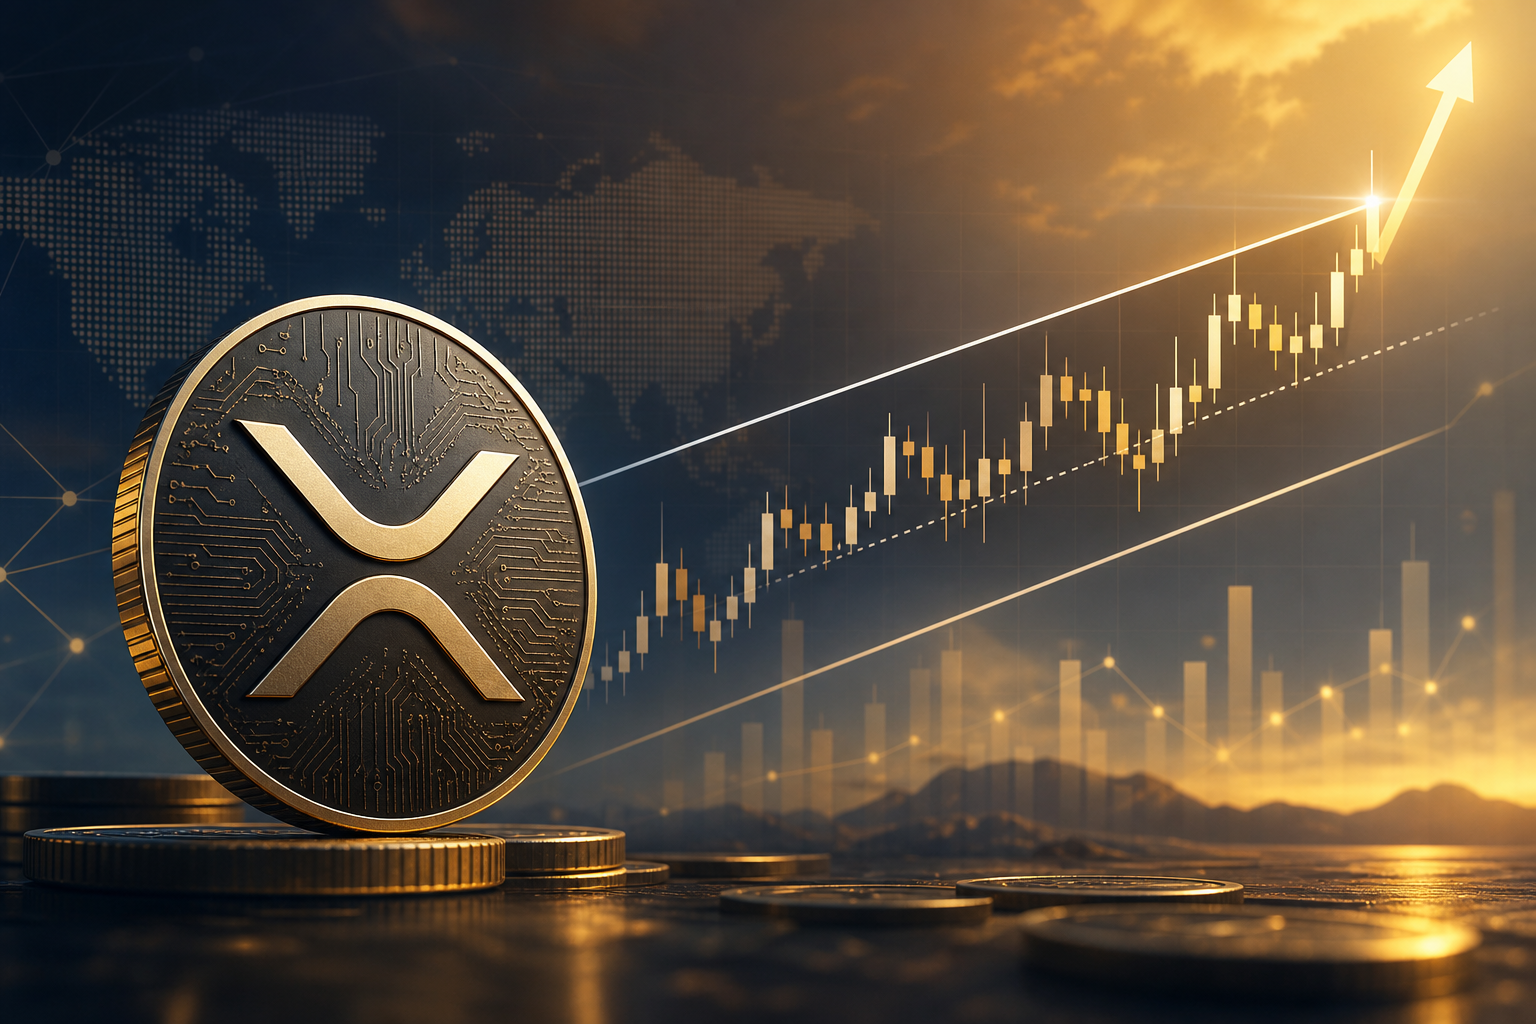
XRP Price Rises Within Range: Potential for a Breakout?
XRP price has managed to avoid a significant downside break and is currently trading above the $0.5220 resistance level. As Ethereum experiences a surge, XRP is back above $0.5220 and showing signs of a possible breakout in the near future.
The price of XRP started to increase steadily above the $0.5150 resistance zone. It is currently trading above $0.5250 and the 100-hourly Simple Moving Average. Additionally, a key bearish trend line with resistance at $0.520 on the hourly chart of the XRP/USD pair was broken.
While a correction in gains is possible, the bulls are expected to remain active near the $0.5180 zone.
XRP price experienced a recovery wave following a drop towards the $0.5065 support level. The recent surges in Ethereum and Bitcoin, with Ethereum rallying over 20% and Bitcoin surpassing $70,000, have sparked positive movements in XRP.
The price managed to climb above the $0.5150 and $0.520 resistance levels, breaking a crucial bearish trend line in the process. It even surpassed the $0.5320 resistance and reached a high of $0.5386.
As the price corrects gains, it might test the 23.6% Fib retracement level of the upward wave from the $0.5064 swing low to the $0.5386 high. Nevertheless, it remains above the $0.5250 level and the 100-hourly Simple Moving Average.
Immediate resistance is expected near the $0.5380 level, with the first key resistance at $0.5420. A close above the $0.5420 resistance zone could potentially drive the price up further, with the next key resistance near $0.5550.
If the price manages to breach the $0.5550 resistance level, it could initiate a fresh move towards the $0.5650 resistance. Subsequent gains might even lead the price toward the $0.5720 resistance.
However, if the price fails to break the $0.5380 resistance zone, a downside correction may occur. The initial support on the downside is likely to be near the $0.5310 level, followed by the major support at $0.5250.
The main support for XRP now sits at approximately $0.5220 or the 50% Fib retracement level of the upward wave from the $0.5064 swing low to the $0.5386 high. If the price breaks below this level and closes below it, it could lead to an acceleration of downward movement. In such a scenario, the price may drop further and test the $0.5065 support in the near term.
As for the technical indicators, the Hourly MACD for XRP/USD is currently losing pace in the bullish zone, while the Hourly RSI (Relative Strength Index) is above the 50 level.
In terms of major support levels, $0.5310 and $0.5220 are worth noting, while major resistance levels are $0.5380 and $0.5420.