


- Santiment experts published a report on the state of the Bitcoin market after halvings.
- In it, they analyzed the main metrics and behavior of different categories of investors.
The Bitcoin market is still in the phase of asset redistribution, with large holders in no hurry to take profits. This follows from a new report from Santiment experts.
During the study, the authors analyzed the behavior of investors and the formation of the Bitcoin price trend during periods of previous halvings based on the following indicators:
- composition of key groups of market participants;
- activity levels;
- the prevalence of buying and selling sentiments;
- general network activity.
On-chain data was used for the report. In particular, these are: distribution of supplies, realized profit or loss, as well as the period of investment of a specific group of traders.

2013 and introduction to indicators
This is the period after the first halving, which occurred in October 2012.. In the third quarter of 2013, the price of Bitcoin increased sharply. However, investors reacted differently:
- Bitcoin whales – from 1000 BTC to 10,000 BTC (blue line). We started selling at the beginning of the rally;
- sharks – from 100 BTC to 1000 BTC (yellow line). Most active group. Bought and sold relatively early. They increased reserves before the peak;
- shrimp – from 0.01 BTC to 10 BTC (red line). They did not sell at the beginning of the rally, gradually increasing inventories.
At the same time, Santiment experts noted that the most prudent behavior is characteristic of medium-sized holders. While shrimp are eyeing even higher prices in the future, whales can afford to take profits early given the size of their portfolios, the report found.
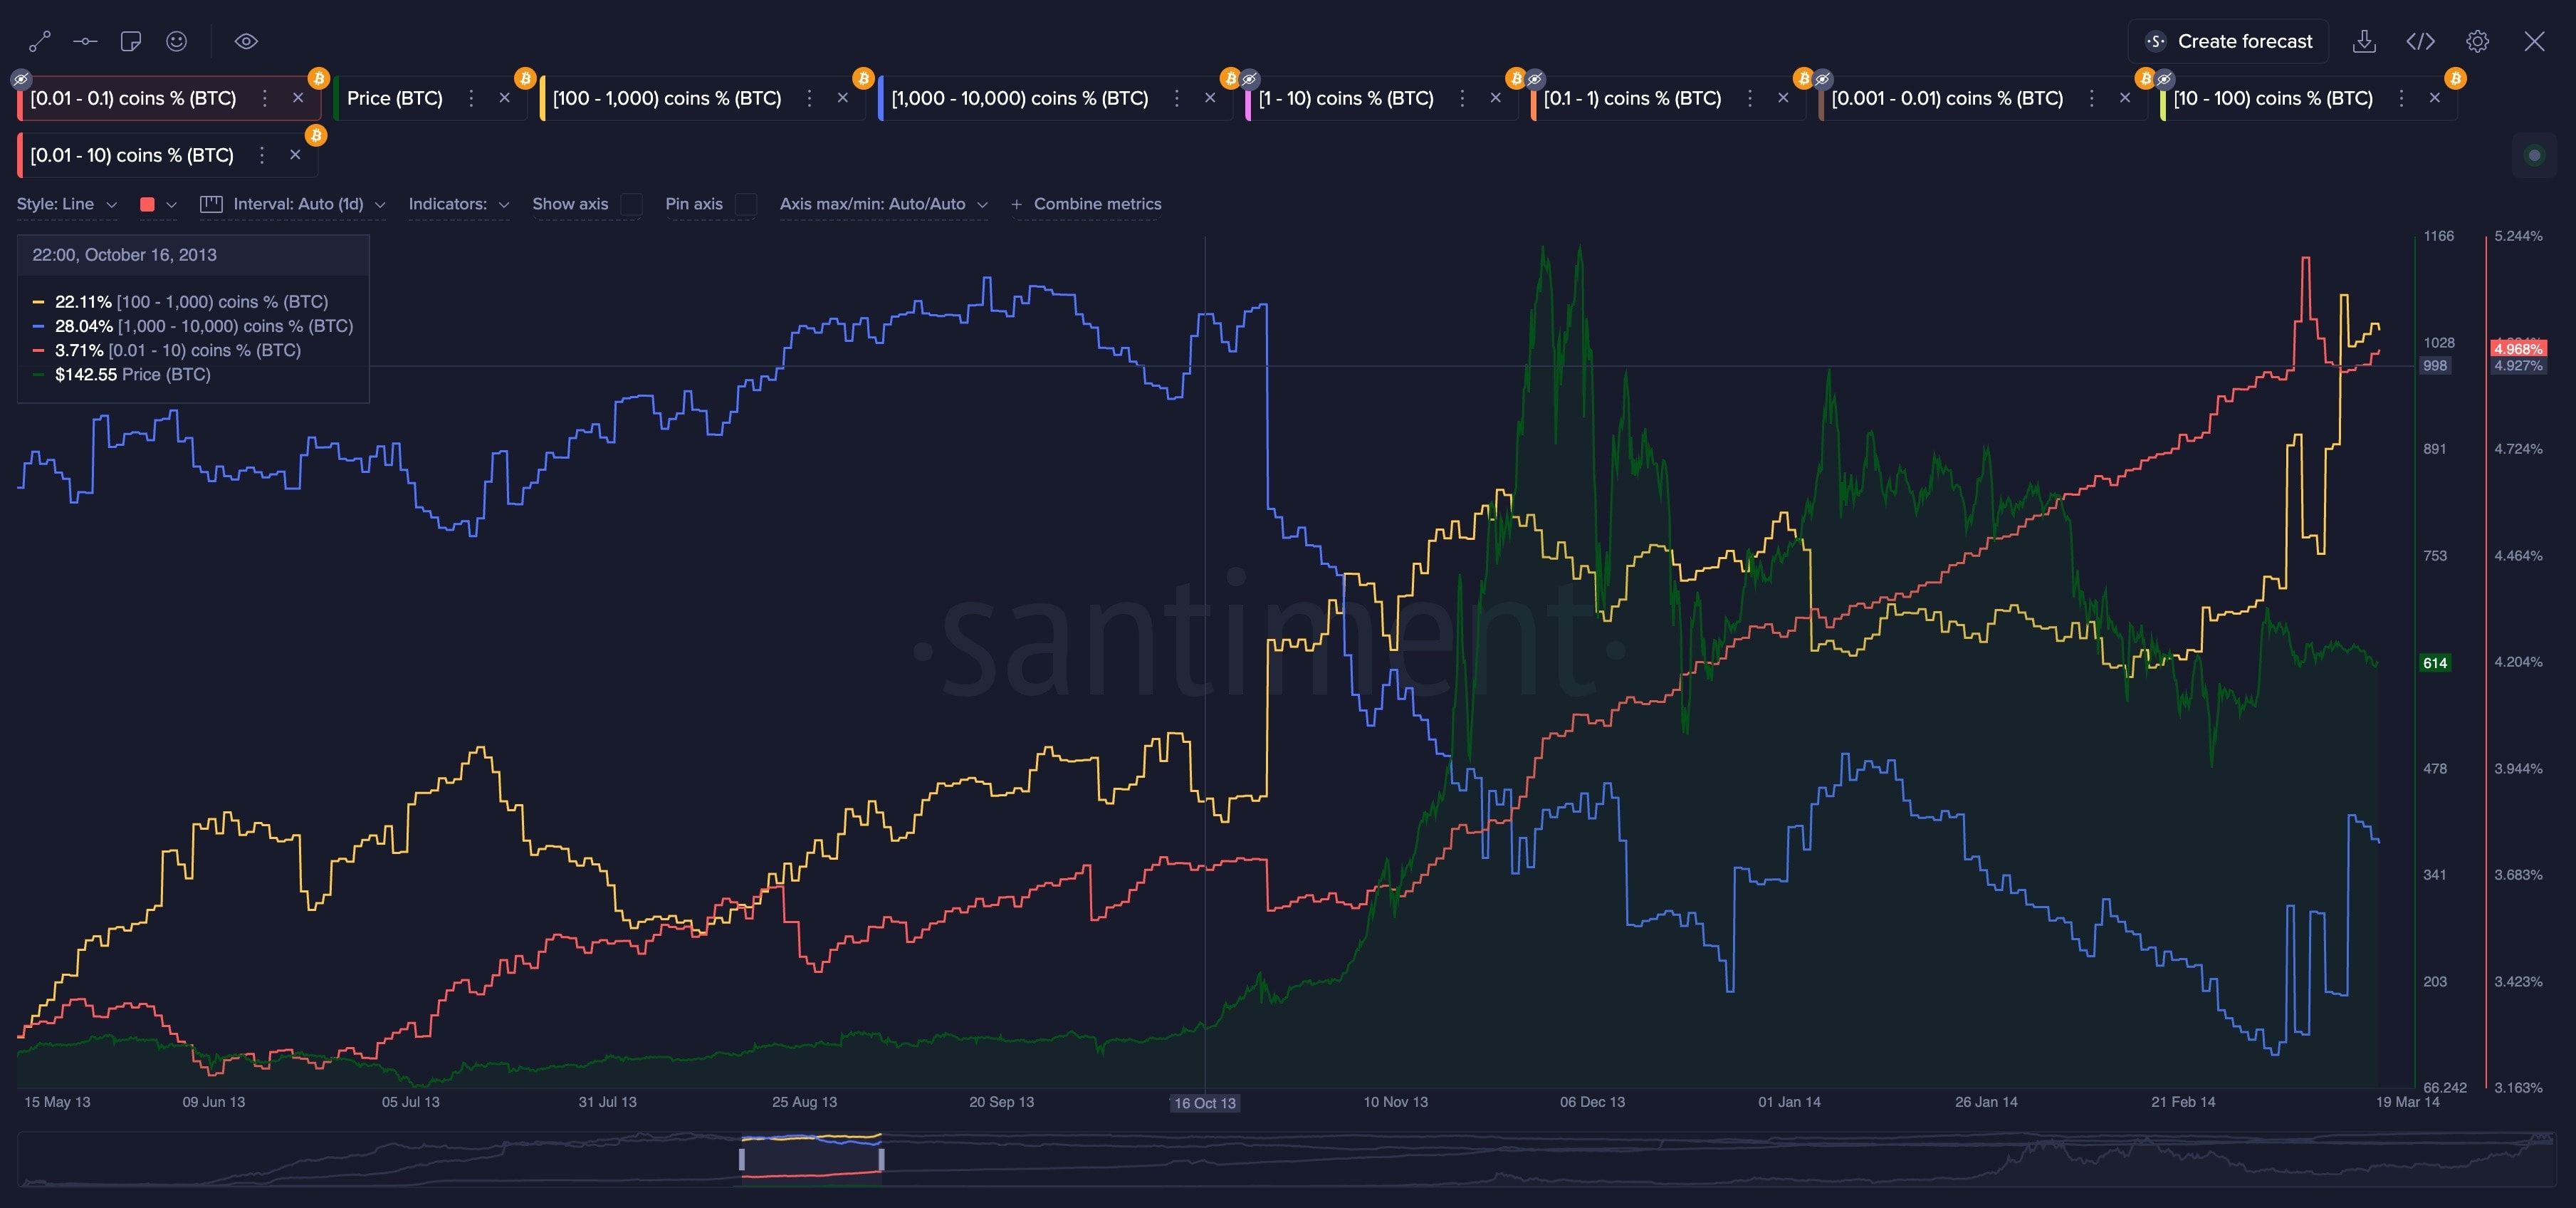 Changes in the share of supply under the control of different categories of Bitcoin traders market in 2013. Source: Santiment
In addition, the platform’s experts used two more indicators – the average dollar investment indicator (MDIA) and the net realized profit/loss (NRPL) metric.
The report says that an increase in MDIA often indicates that the circulation of coins on the network is slowing down, that is, the age of investments is increasing. A decrease in the indicator, in turn, may indicate impending market turmoil.
This can be seen in the following graph:
Santiment experts believe that a decline in MDIA indicates the beginning of a bull market. After redistribution, a repeated phase of accumulation begins, the report emphasizes.
NRPL, in turn, calculates the average profit or loss for all coins that change addresses daily, Santiment added.
This metric is based on the assumption that the last price an asset moved is its value at the time of purchase.. If the coin changes address, it is considered sold. In this case, the last price will be its sale price, as stated in the report.
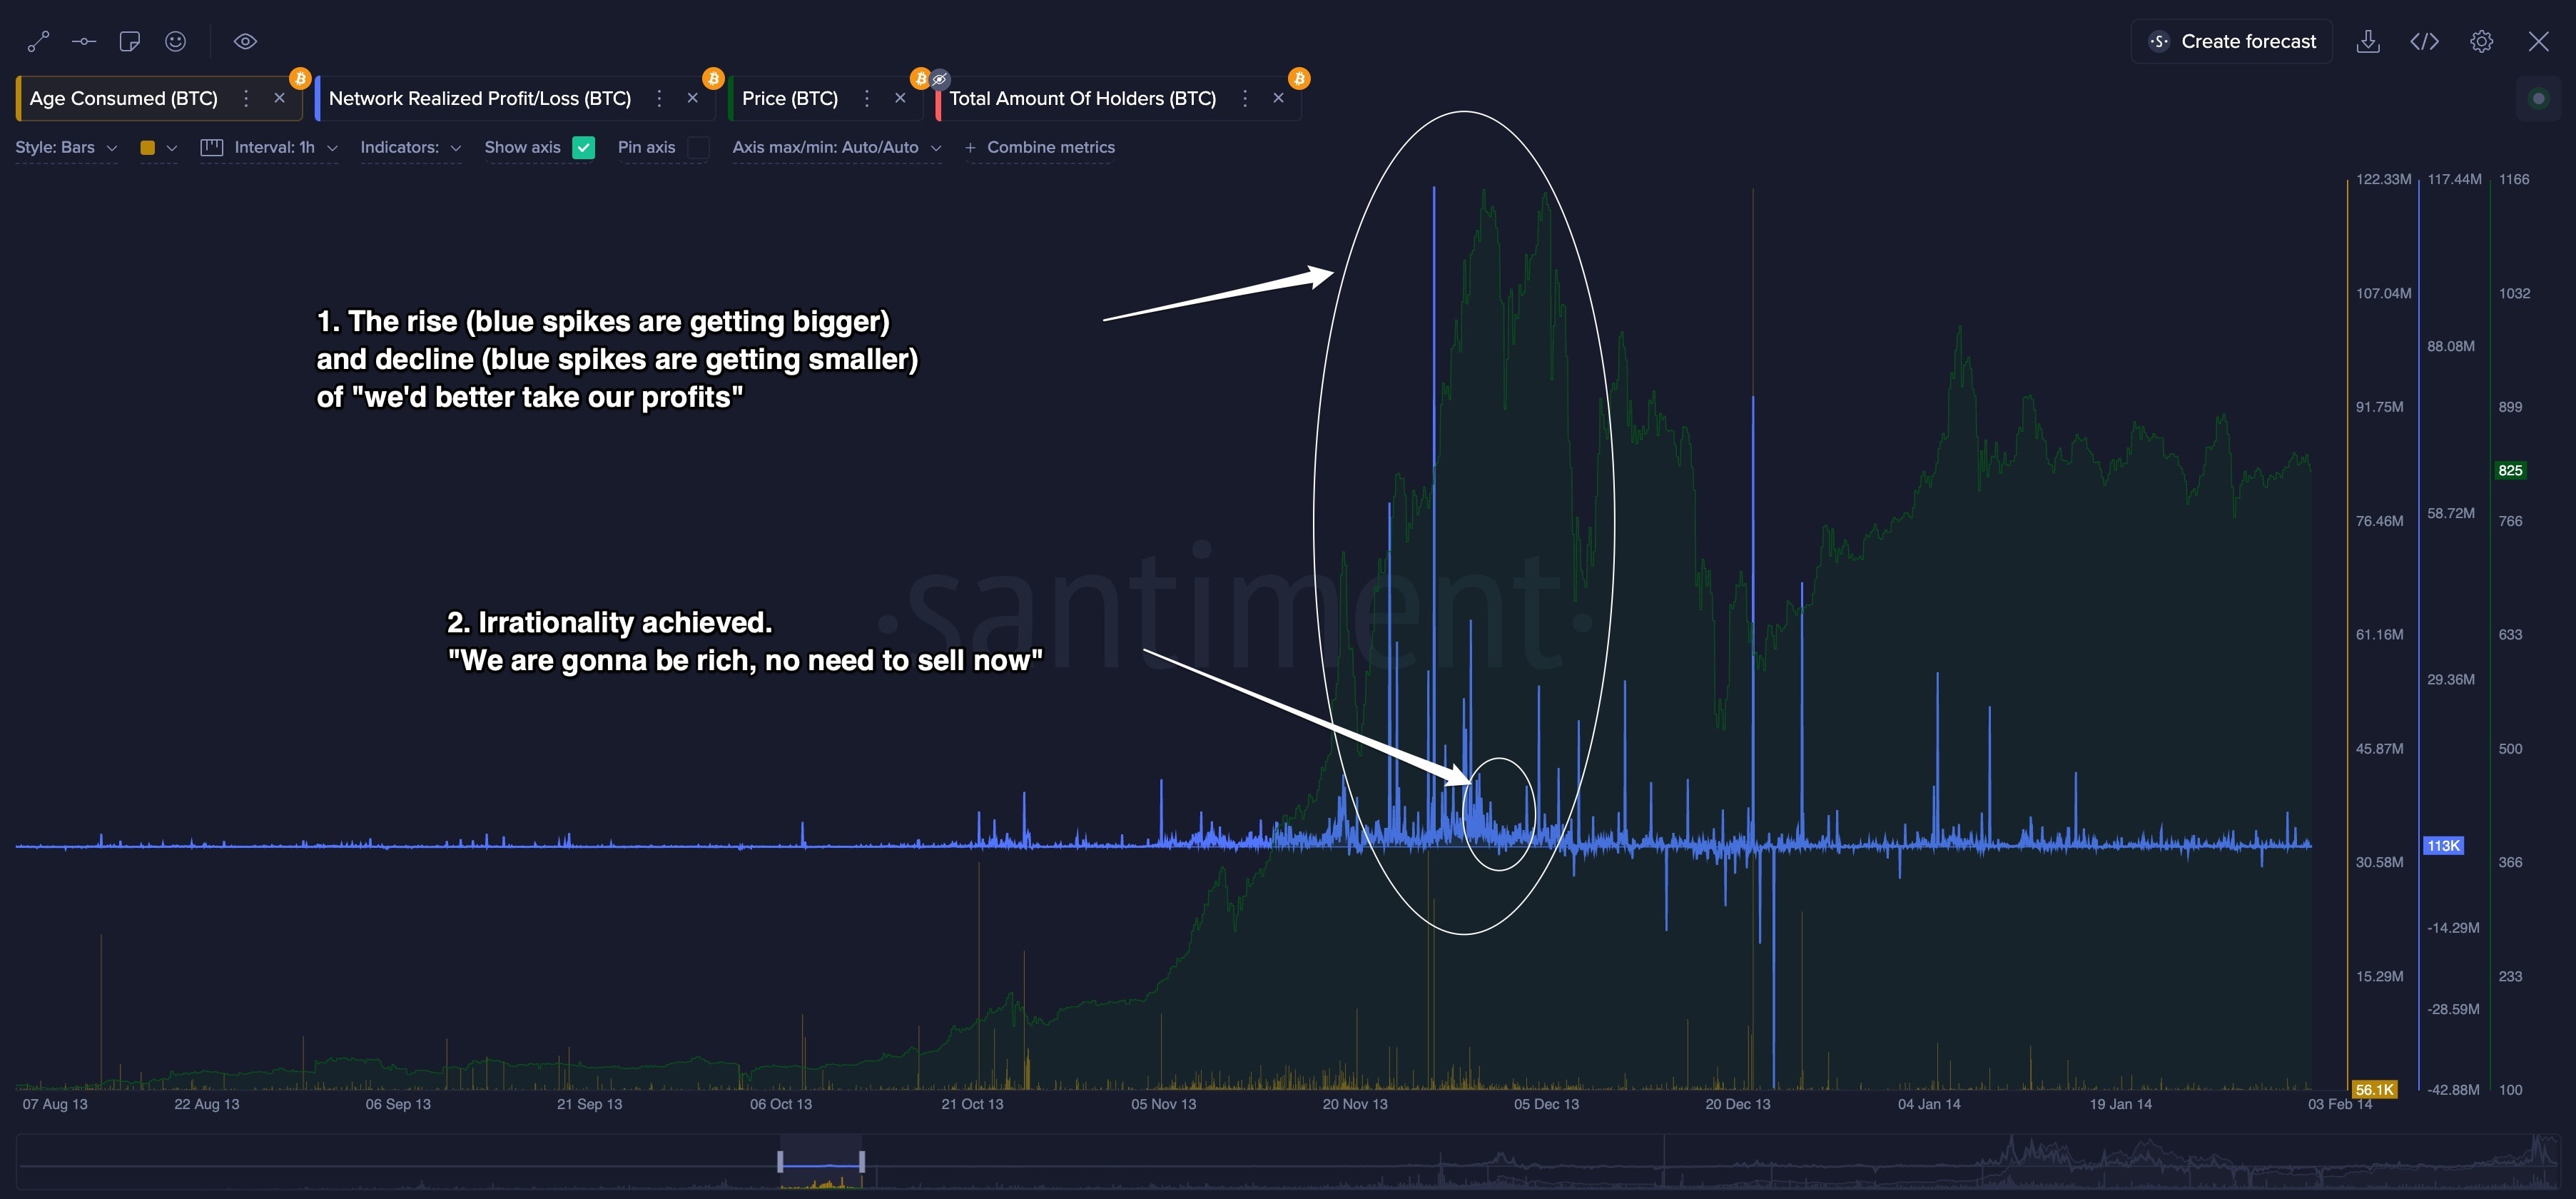 Change in the NRPL indicator on the Bitcoin market. Source: Santiment
To understand the trend in the market, it is necessary to compare NRPL with other indicators, noted Santiment. It is important to take into account the “irrational divergence,” which indicates a decrease in realized profits in the face of rising prices.
Trends in the Bitcoin market in 2017 and 2021
The NRPL chart in 2017 looked like this:
As you can see, the graph shows both “healthy” growth and “irrational divergence.”
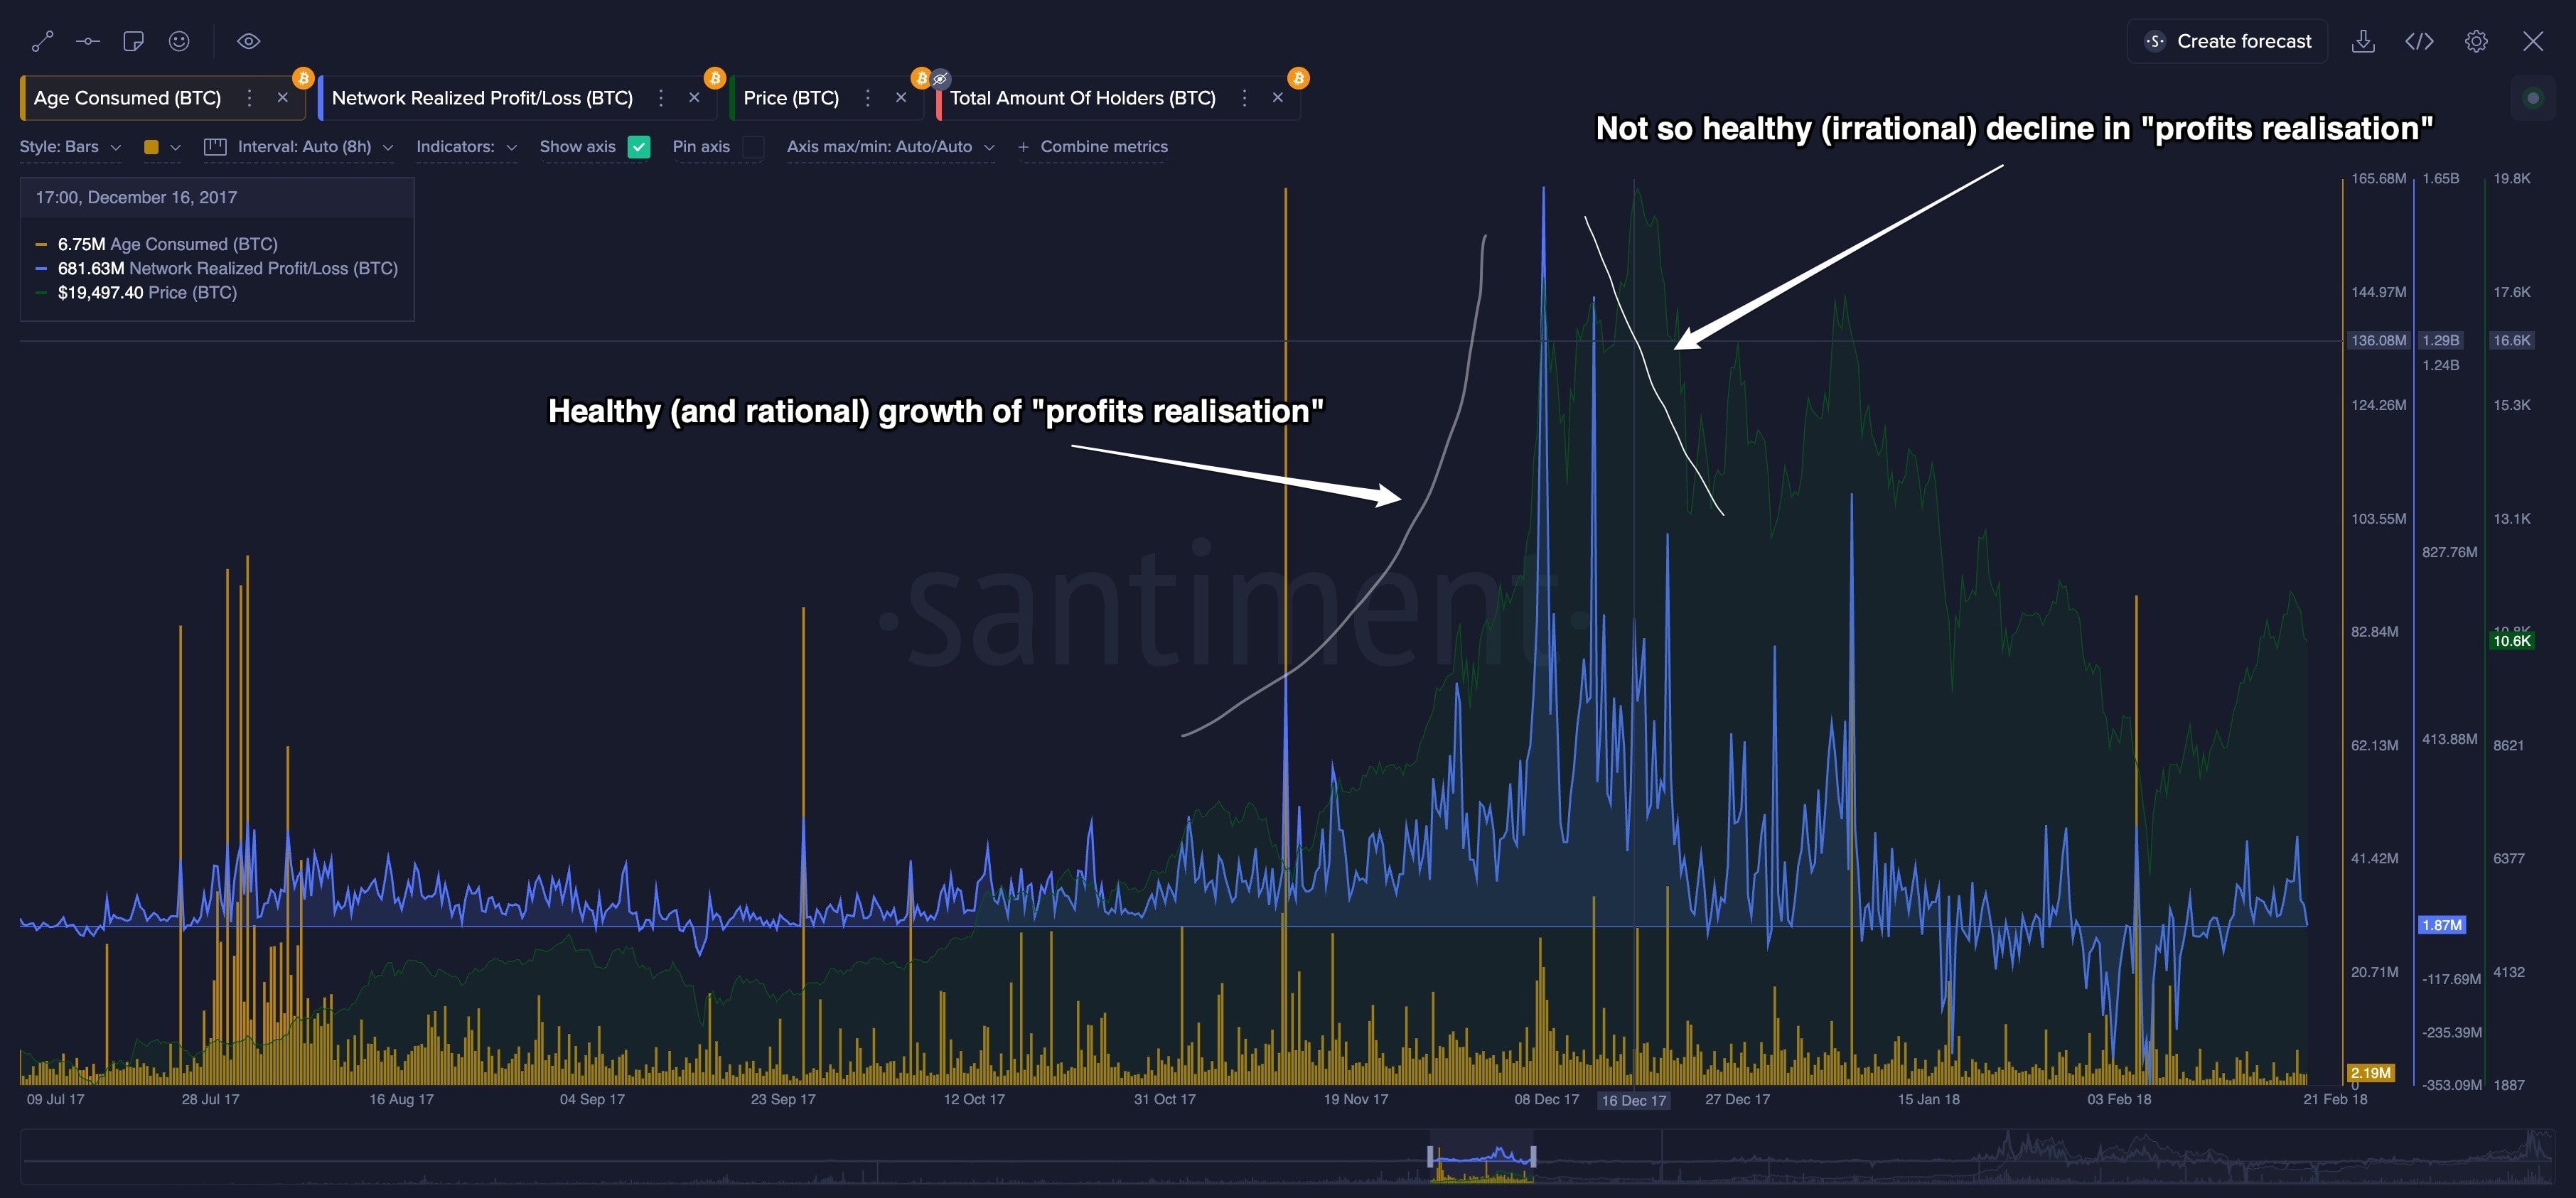 Changes in the NRPL indicator in 2017. Source: Santiment
This pattern of consistent “healthy” growth followed by “irrational divergence” continues in 2013, 2017 and 2021, according to the report.
This is how platform experts explained it:
“As the price of BTC rises, profit realization also increases until it reaches a key point where divergence occurs. Despite the continued rise in prices, the desire to take profits is decreasing. This phase marks a shift in market sentiment towards extreme bullishness, with the prevailing strategy shifting towards holding or even accumulating more assets.”
As for the behavior of different categories of investors, during the 2017 rally their actions looked like this:
The situation generally corresponds to that recorded in 2013. Shrimp tend to accumulate, whales tend to lock in profits, and sharks tend to have a dynamic pattern. At the same time, the largest holders are trying to increase reserves during the recession phase, the report emphasizes.
If you compare the cycle with the MDIA indicator, you can see that there is an inverse correlation between it and the growth phase:
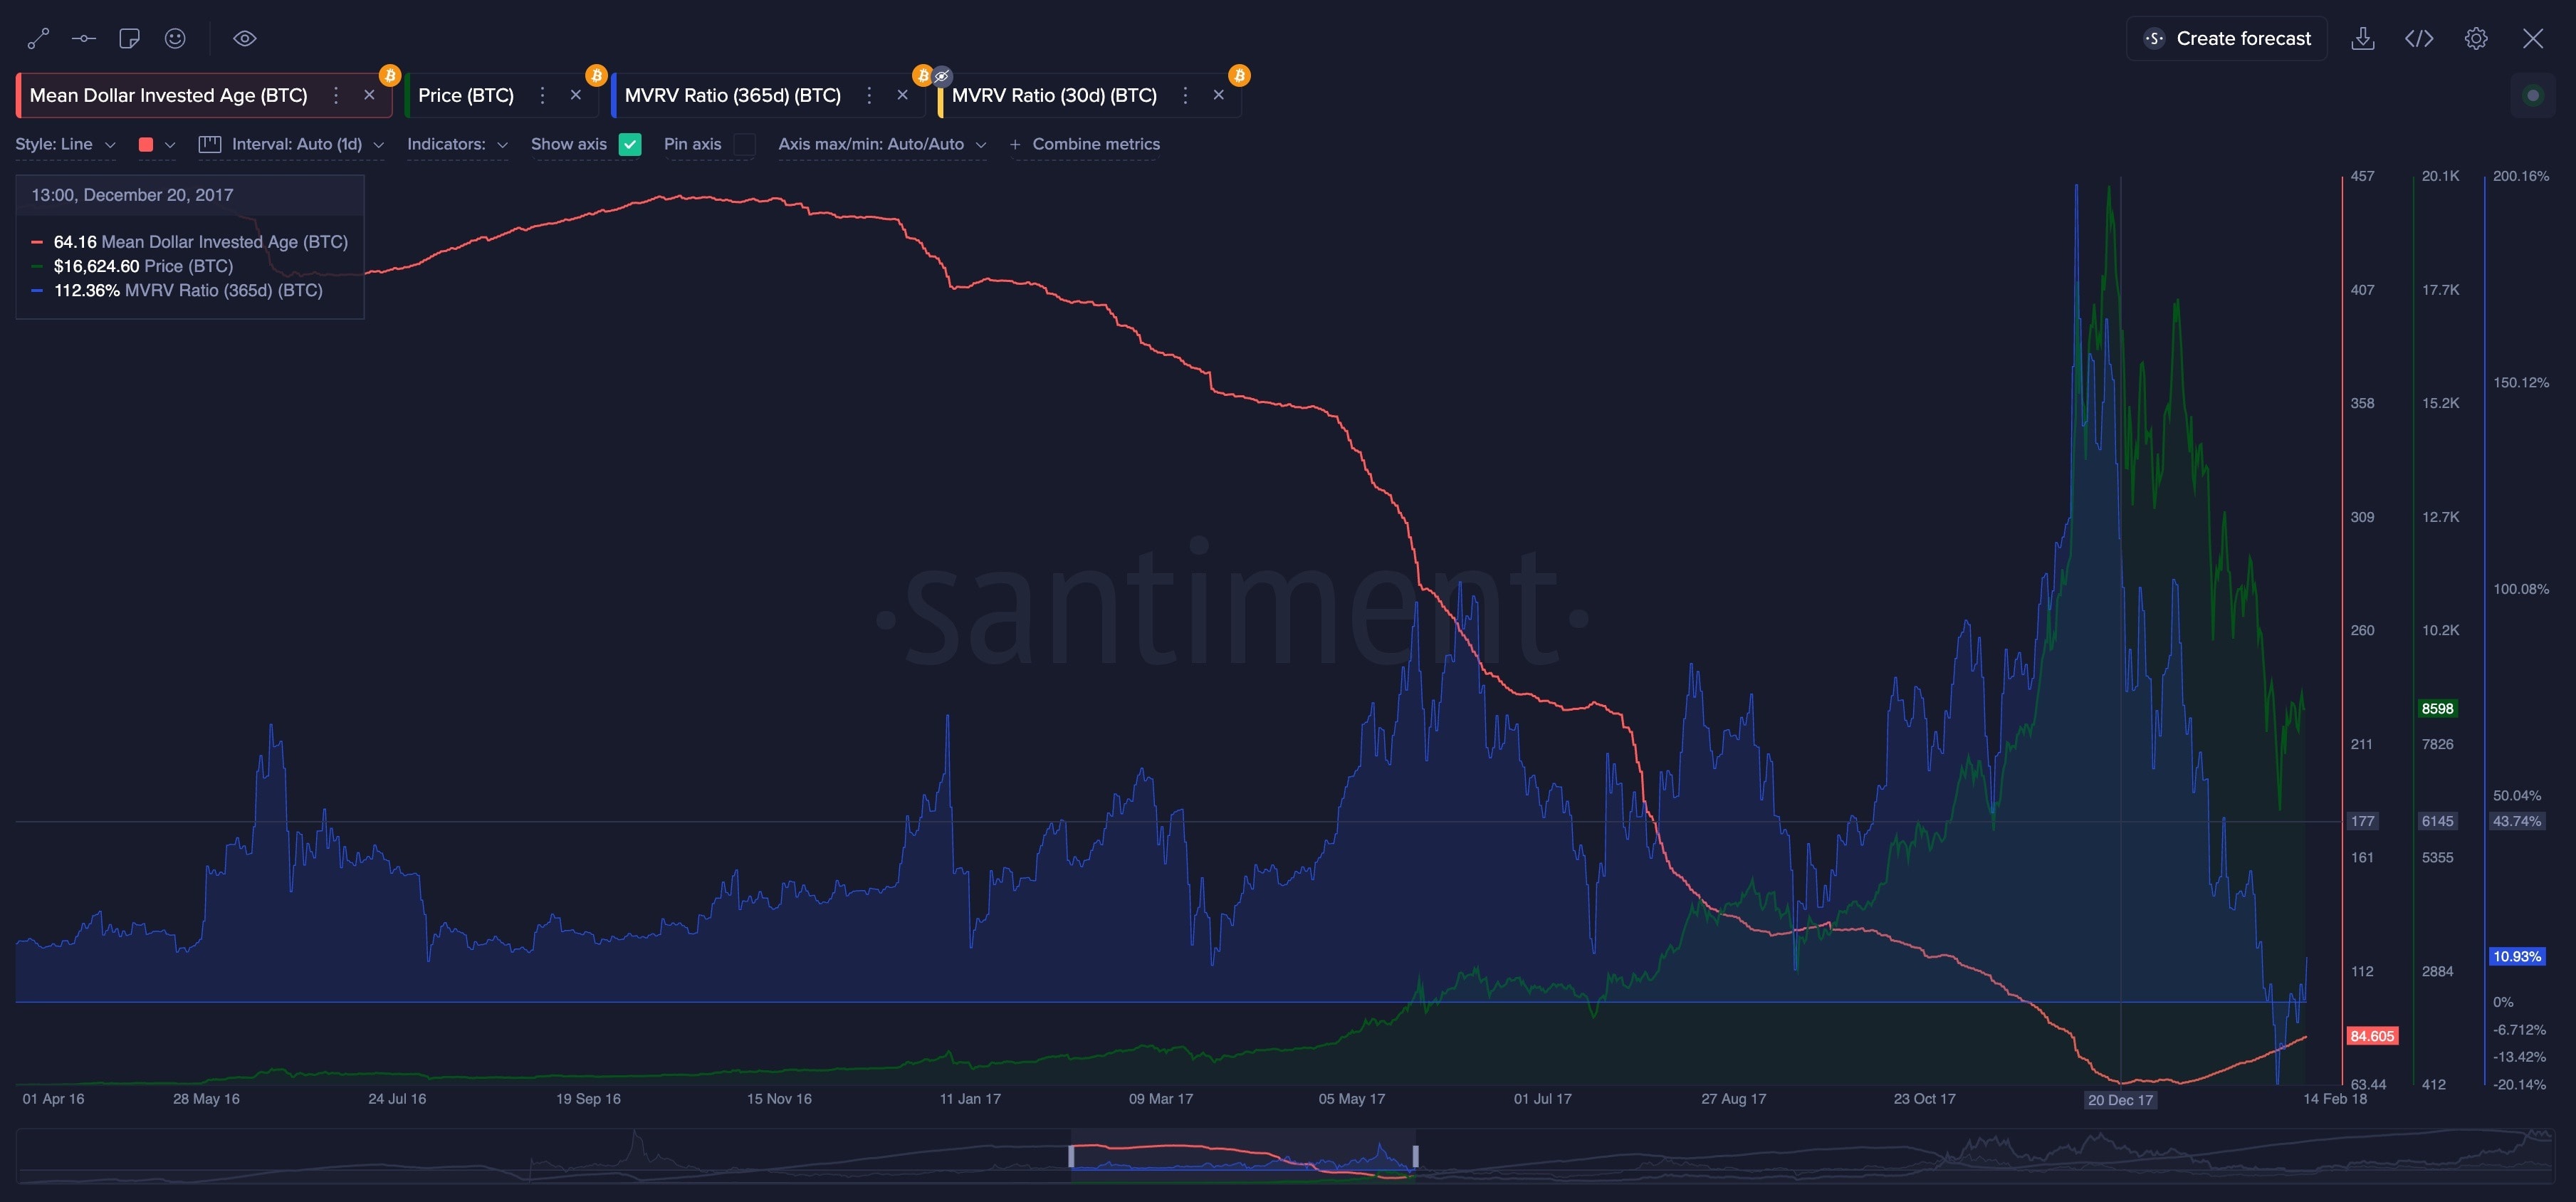 Relationship of the MDIA indicator with the price of Bitcoin and other indicators. Source: Santiment
“In 2017, the cycle of redistribution and accumulation lasted just over a year. This long period is crucial for understanding the duration of market phases and preparing for potential changes in market dynamics,” the experts emphasized.
The situation in 2021 is distinguished primarily by the double top on the NRPL chart. After the “irrational divergence” there was a reversal. This made it difficult to determine the second vertex:
Asset redistribution phase completed by April 2021. After this, as the MDIA metric shows, the accumulation stage began:
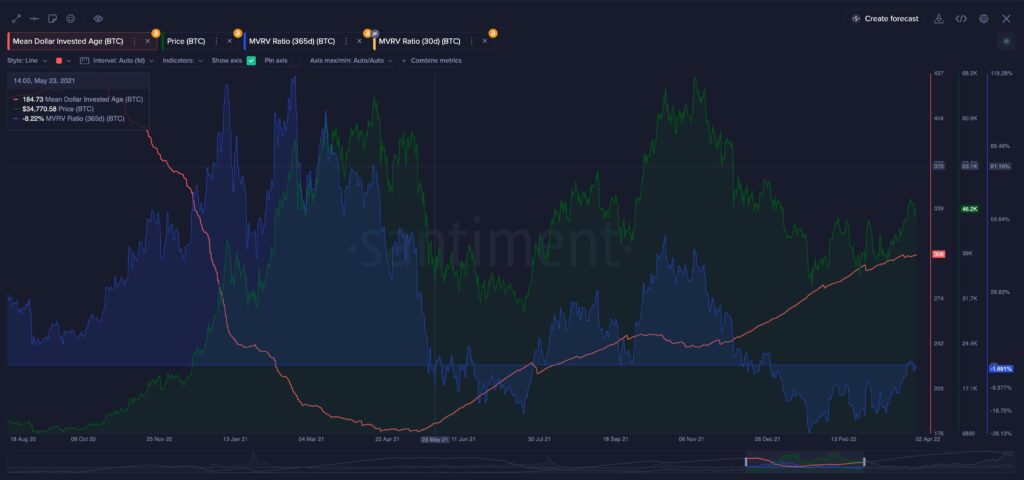 Relationship of the MDIA indicator with the Bitcoin price and other indicators. Source: Santiment
Santiment experts believe that it was the global shift in strategy towards accumulation that led to the formation of a second top on the NRPL chart later in 2021.
As can be seen in the chart above, in anticipation of the highs (April, November 2021), whales were actively selling. Sharks and shrimp, in turn, increased their reserves at this time. However, after June 2021, all three categories of investors switched to accumulation, the report emphasizes.
Santiment experts believe that this is what paved the way for the subsequent bearish phase in the market.
Current Market Trends and Forecast
As of April 2024, that is, immediately after the halving, the NRPL indicator did not show high extremes. This indicates a reluctance to sell on the part of investors.
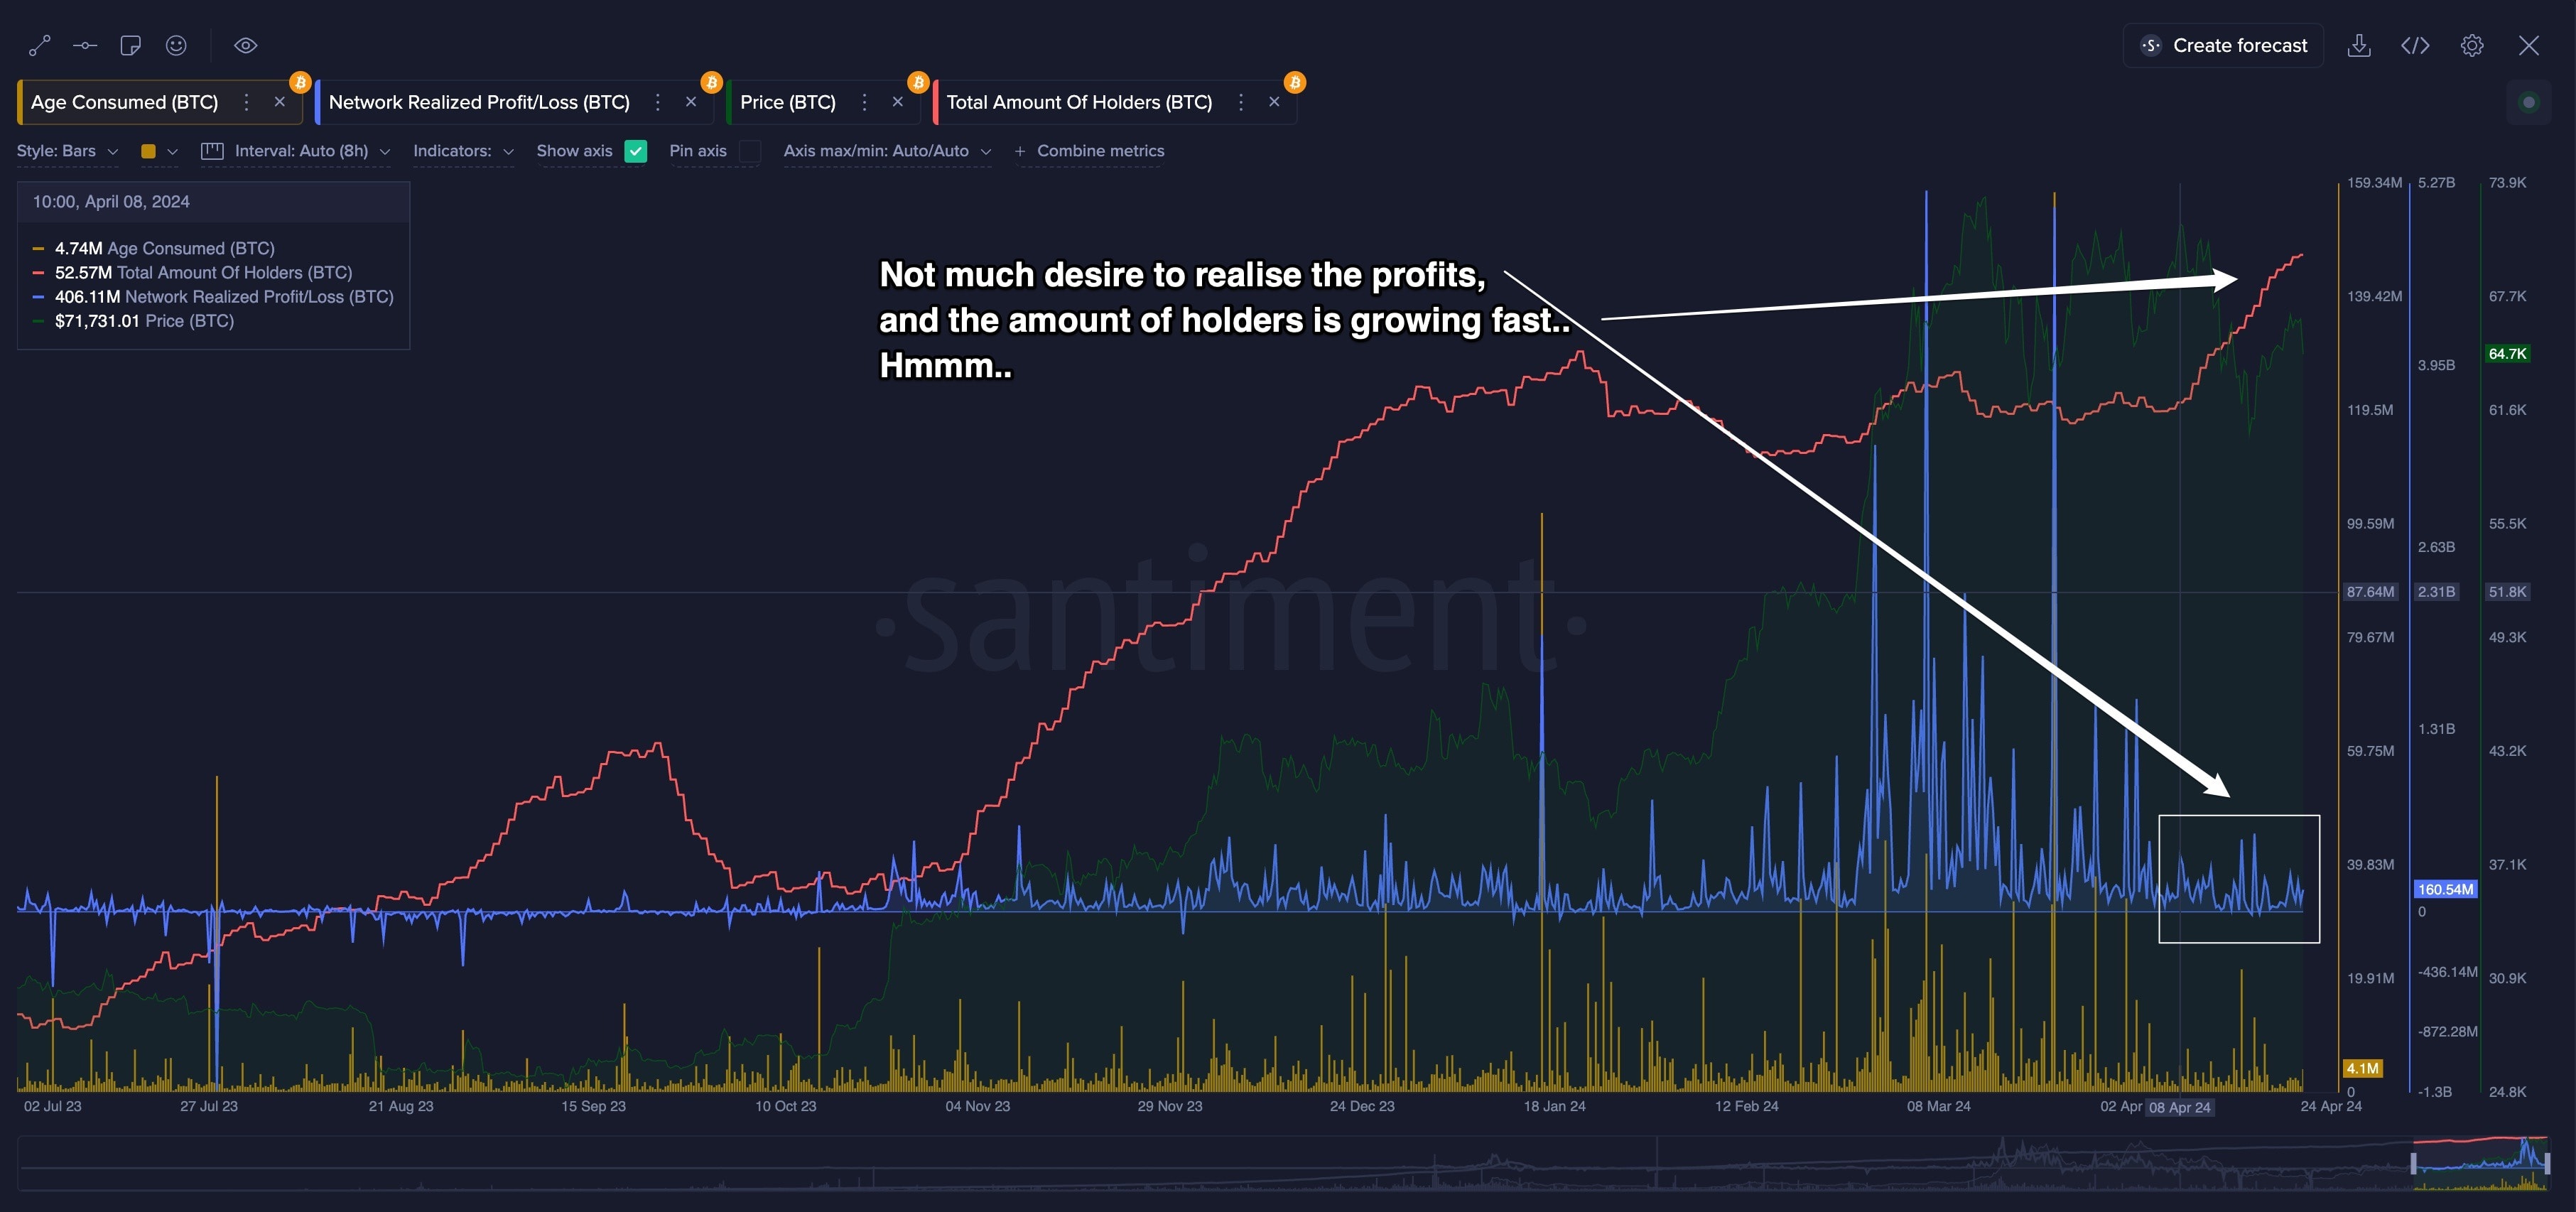 Changes in the NRPL indicator in 2024. Source: Santiment
At the same time, according to experts, the market is still in the phase of asset redistribution. This is indicated by the MDIA metric (red line). However, as can be seen in the chart, bullish trends may appear in the market in the near future, since the indicator has begun to fall.
As for the trends towards accumulation and sale, experts noted that the situation here is ambiguous. It is mainly small holders who are increasing their reserves. Whales are also in no hurry to sell, which cannot be said about sharks, which may indicate a redistribution of assets in portfolios in favor of higher-risk ones:
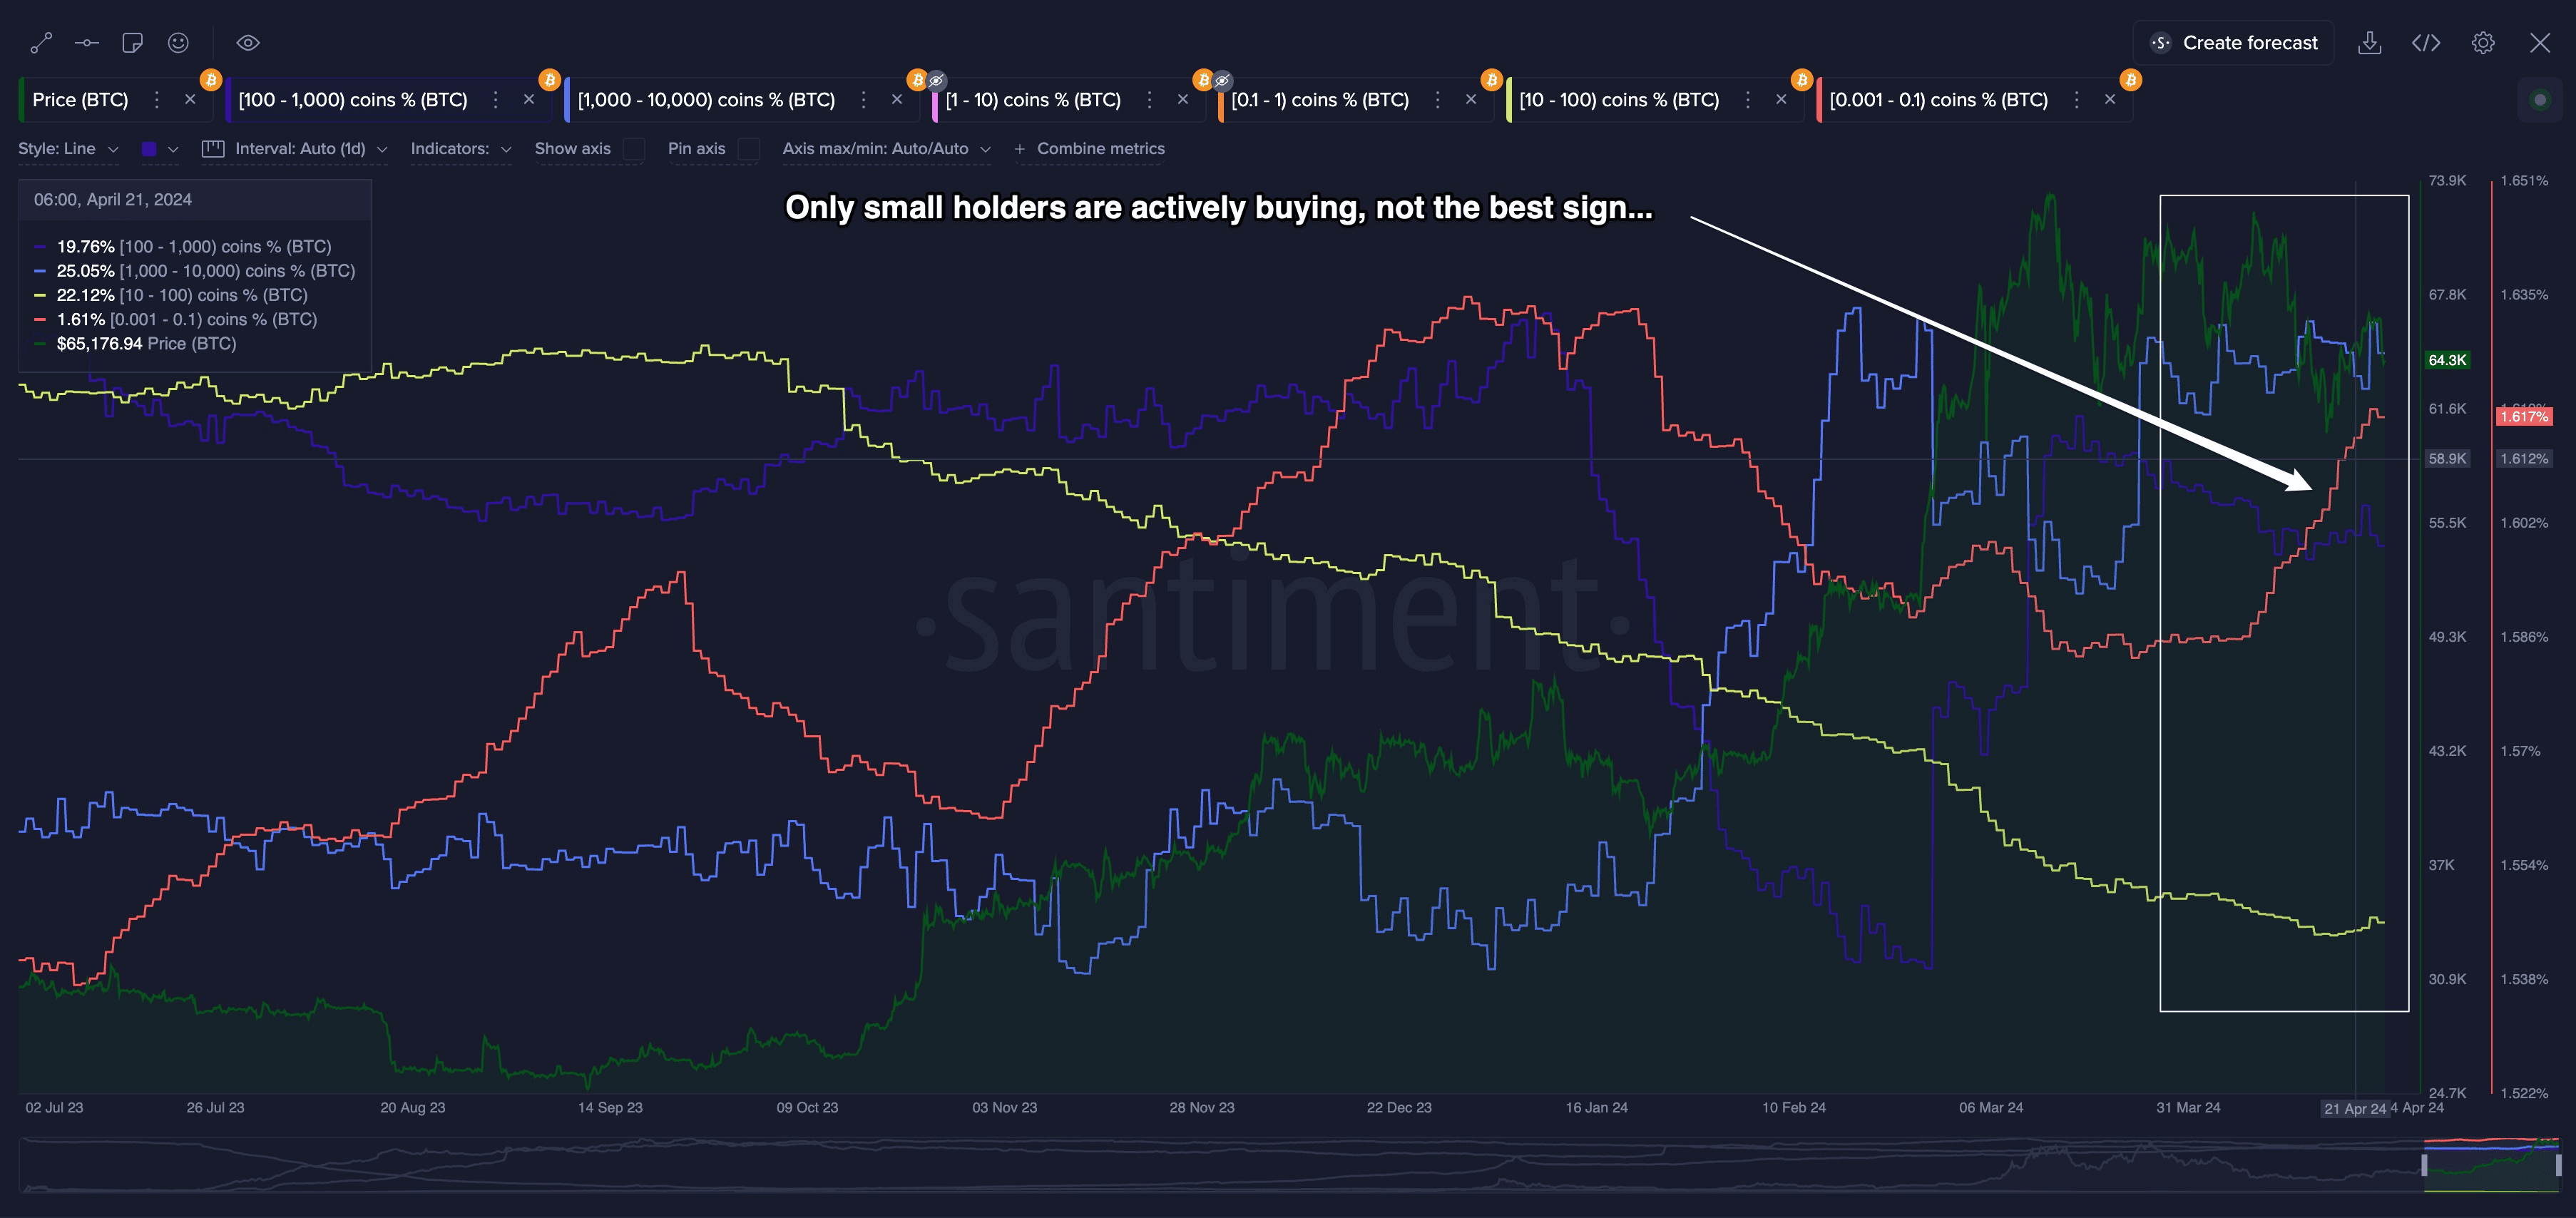 Changes in the share of supply under the control of different categories of Bitcoin traders market in 2024. Source: Santiment
In conclusion, Santiment analysts do not give any clear forecasts. According to the report, the answer to what the situation on the Bitcoin market will be in the future depends primarily on the category of investor, his behavior pattern and risk appetite.
However, experts still noted that it is necessary to exercise caution and try to formulate the “right questions.”
Note that we previously covered a similar report from the CoinGecko platform. From it you can also find out how the price of Bitcoin changed after each of the halvings.