


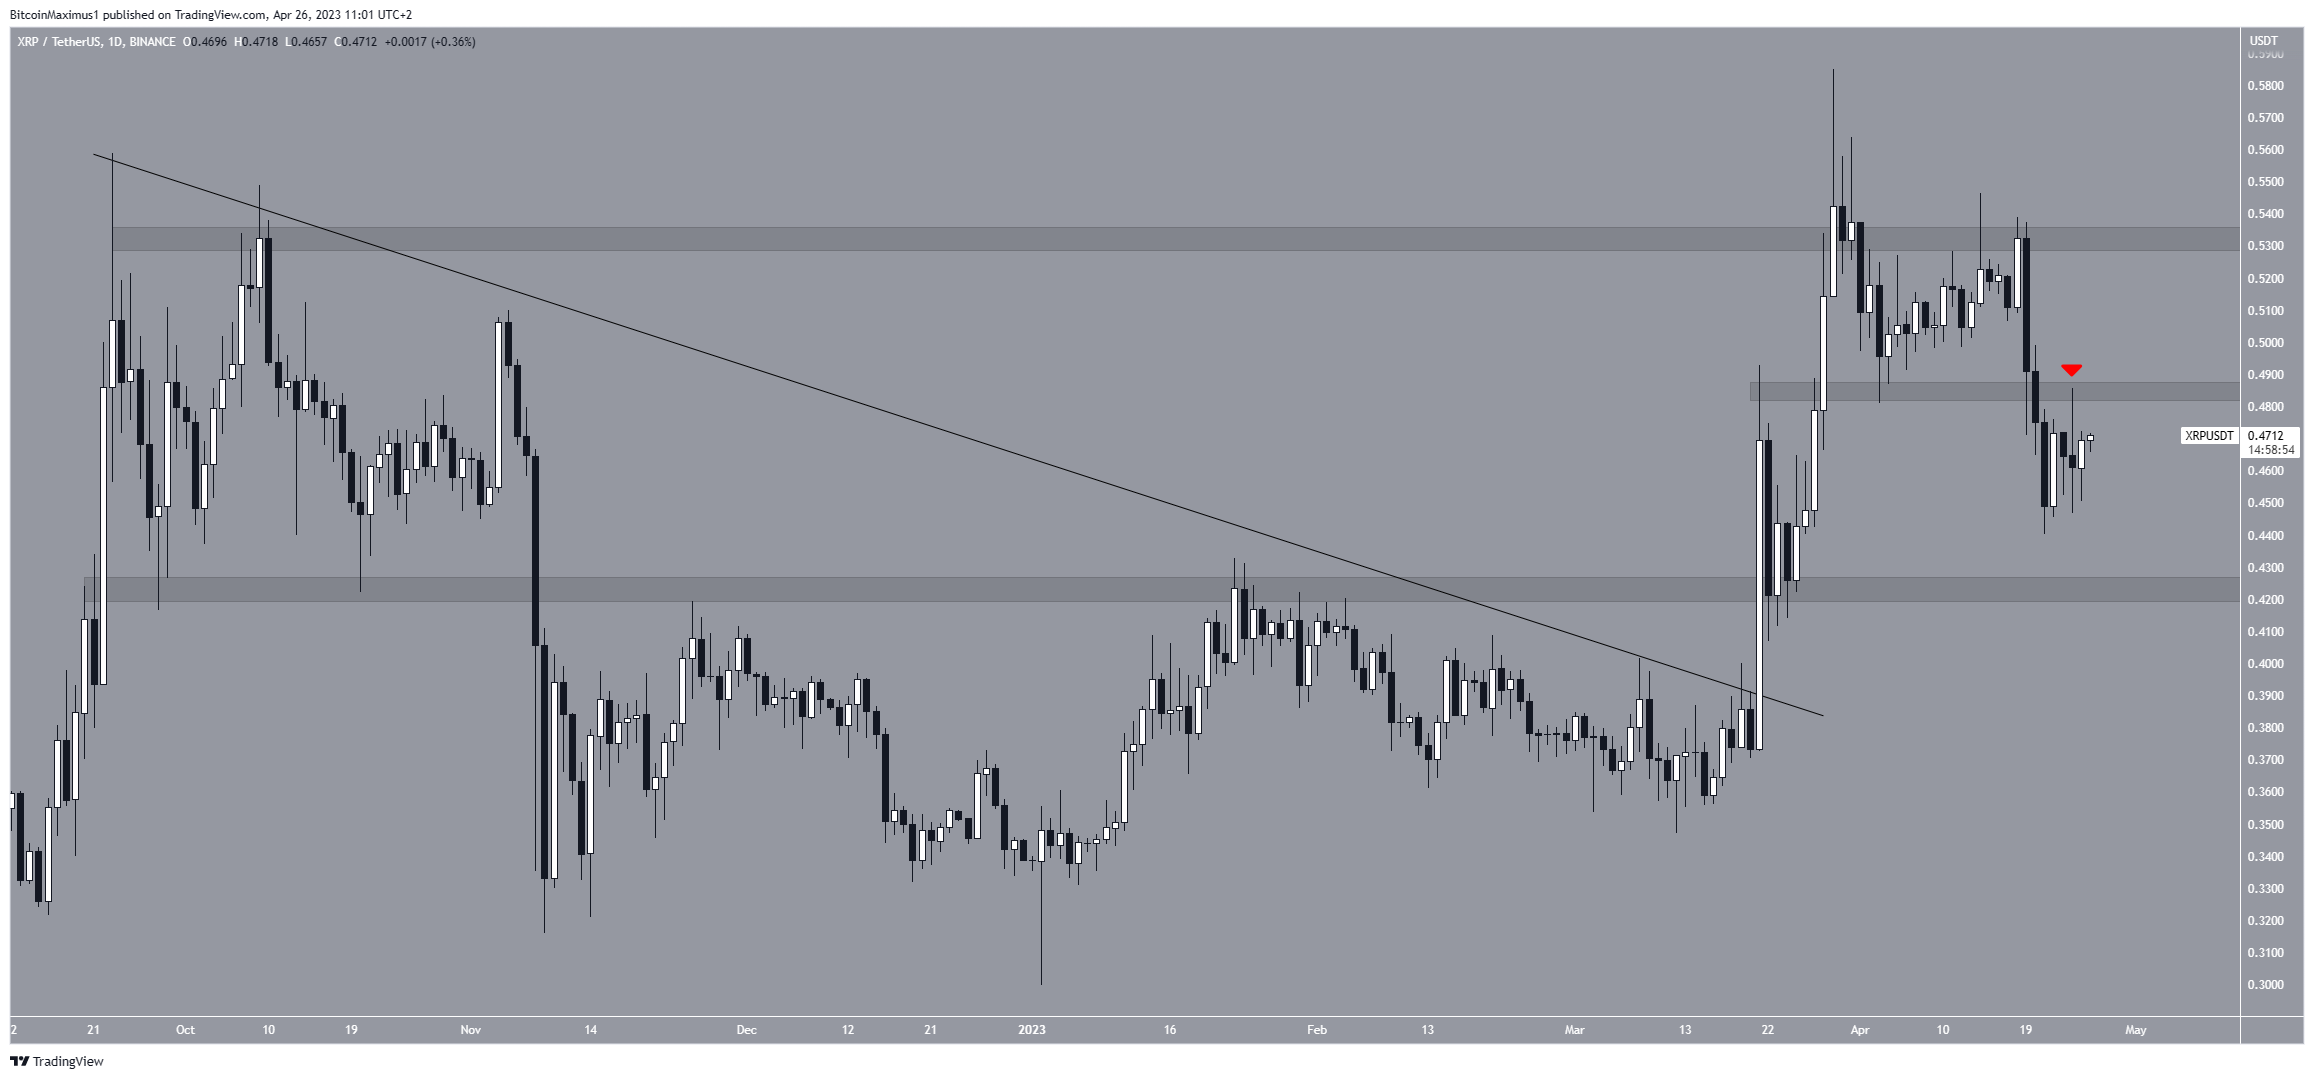
The Ripple (XRP) exchange rate declined noticeably on April 19 after rebounding from an important resistance area. However, the formation of the bottom may determine the market reversal.
The native token project Ripple (XRP) broke through a downward resistance line on March 21 and rose. On March 29, the price renewed the high of the year at $0.585.
However, this was followed by a decline, which threatened the current bullish structure.
The Ripple price sank to an important resistance.
Ripple Price Slept Under Important Resistance
As indicated by technical analysis, XRP hit a high of $0.585 on March 29 and has been declining ever since..
Despite breaking through the resistance area of $0.530, the long upper wick on the chart suggests price weakness and means that this area is now playing the role of resistance again.
On April 18, the price made a declining high before falling again and then breaking through the $0.485 horizontal area the next day.
On April 24, Ripple tested this area as resistance, forming another long upper wick (red icon) over the next 24 hours.
Such wicks are considered a sign of pressure from sellers and demonstrate that buyers cannot support the price.
As for the news background on Ripple, The day before, the head of the company Brad Garlinghouse confirmed Ripple Labs’ willingness to leave the US for cryptocurrency-friendly jurisdictions amid a protracted conflict with the Securities and Exchange Commission (SEC).
Wave analysis promises XRP exchange rate to rise 50%
Wave analysis of the 6-hour chart, meanwhile, suggests that XRP’s prospects could be very optimistic.
According to its results, the price has now completed the 4th wave of a five-wave bullish structure. This could be seen as a positive signal.
In this prediction, XRP could rise above resistance of $0.530.
The most probable target for this movement is the area between $0.673 and $0.722 (the Fibonacci level of 1.61 of wave 4 extension (black) and the length of waves 1 and 3 projected to the base of wave 4 (white)).
Fibonacci levels are traditionally considered the most probable springboards for stopping and reversing the price after a significant advance in any one direction.
At those levels, the market is expected to regain some of the ground it has covered and then move back in the original direction.
As the analysis suggests, if XRP breaks through $0.485, it may return to $0.530.. If there is a rebound, the token could fall to $0.425.
If it rebounds, the token could fall to $0.425.
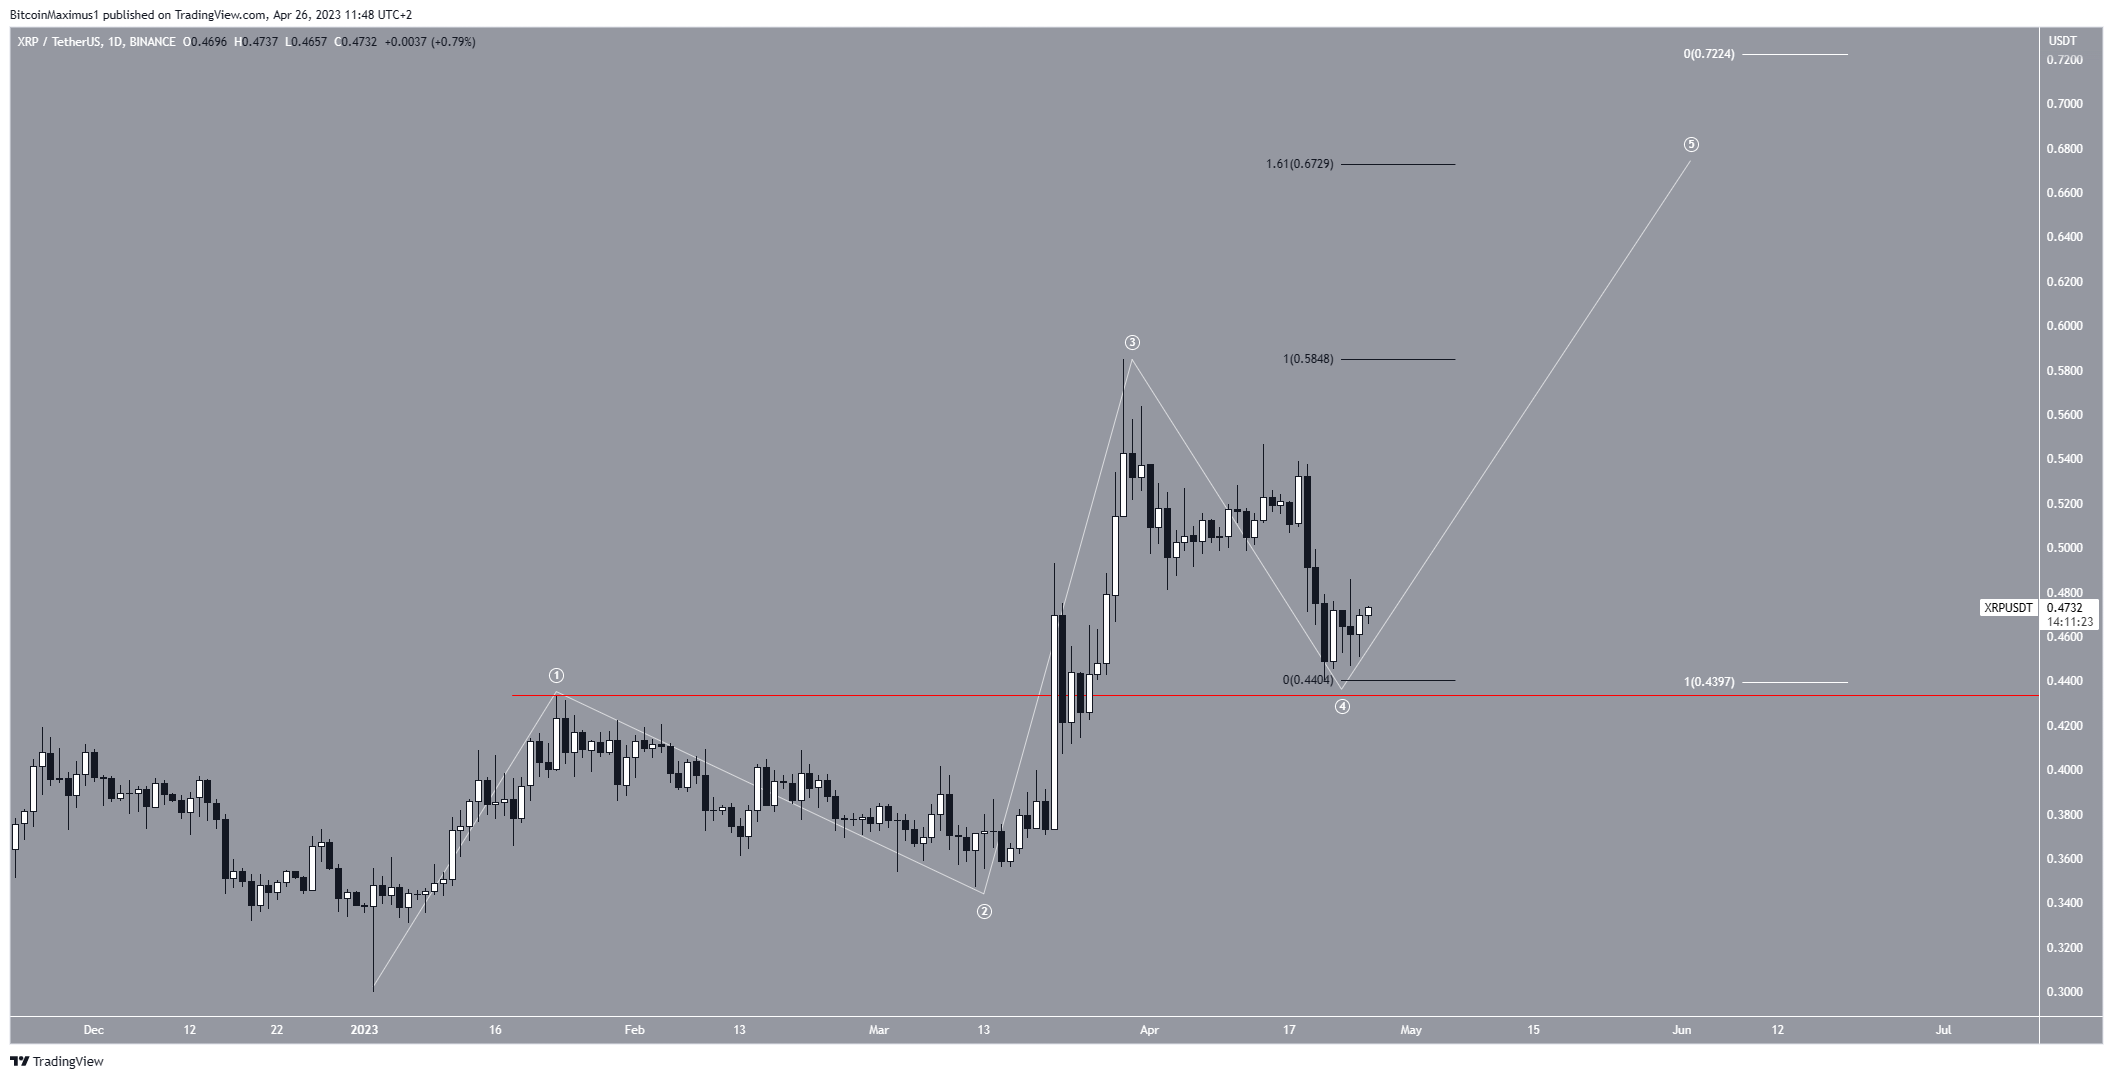
In addition, the absorption of the wave 1 high at $0.430 cancels the bullish outlook for XRP. In that case, the price could fall to $0.360.
As BeInCrypto’s editorial staff told us earlier, the fundamentals onchain indicators of XRP suggest that the trend may soon change to an uptrend.