
















































Shorts crowd crypto market near Bitcoin breakout levels
Crypto market short liquidations happen when leveraged short positions are forced to close after price rises past a set level. On 28 May 2026, the source post showed short sellers crowding into the market near two very specific danger zones: roughly $84,000 and roughly $2,310. I’ll be honest: this is the kind of setup that looks boring until it suddenly is not. According to the post, a move to about $84,000 would trigger more than $6,180,000,000 in short liquidations. A move to around $2,310 would trigger more than $3,650,000,000. That is the part traders care about. Price rises, shorts close, forced buying kicks in. It can snowball fast.
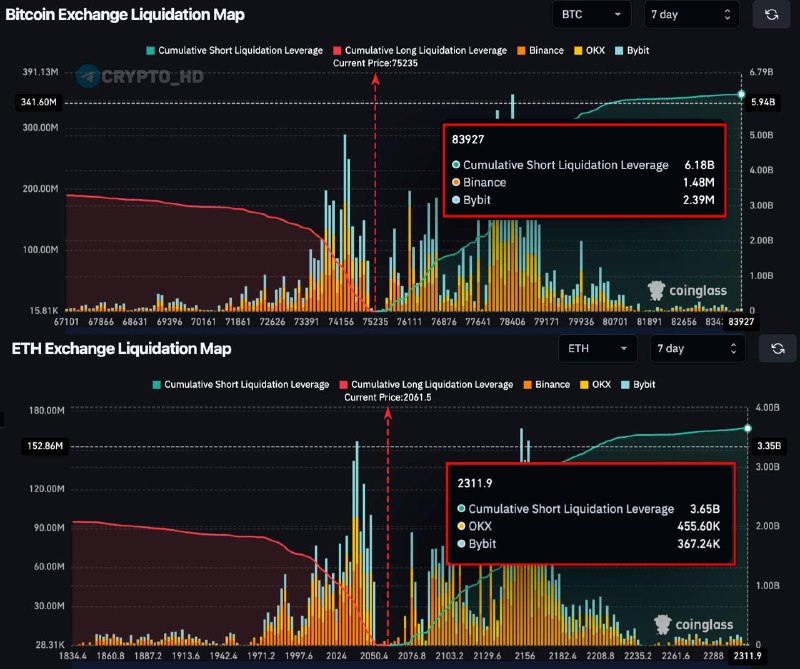
Liquidation maps show price levels where leveraged positions may close automatically, giving traders a sense of where volatility could pick up. The source does not name the tickers, so any asset label here is an interpretation rather than a direct claim from the post. Still, my take: the ~$84,000 level reads like Bitcoin (BTC), while the ~$2,310 level reads like Ethereum (ETH). Most guides treat liquidation maps like prediction tools. That is only half right. They show where leverage may get stressed; they do not prove that BTC or ETH must trade there. The basic read is narrower and more useful: bearish leverage looks crowded, and if price jumps, shorts may have to chase the move instead of pressing against it.
Liquidation maps identify pressure points for leveraged traders. They do not tell you where price will go next. If BTC moves toward the ~$84,000 area, the source says short liquidations would top $6,180,000,000. Why does this matter? Because that kind of forced closing can mimic real demand for a while. It may look like a clean rally, but the engine could simply be short sellers buying back exposure under pressure. Different beast. Liquidation moves can be ugly, fast, and mostly over by the time everyone agrees on the explanation.
Macro-flow analysis looks at the bigger forces behind asset prices, including interest rates and dollar strength. That backdrop matters on 28 May 2026. BTC and ETH still trade like high-beta liquidity assets when rates, inflation expectations, or the dollar jolt risk appetite. A crowded short setup near ~$84,000 for BTC and ~$2,310 for ETH means a softer macro signal could hit leveraged shorts before it convinces spot buyers. Yes, this cuts against the clean “breakout equals demand” story. Bear with me. Spot buyers might come in later. Or they might not. This is where traders get trapped.
The safe-haven argument says Bitcoin may rise when confidence in traditional finance weakens. That is the bullish counterpoint, and it is not nonsense. BTC bulls often argue that Bitcoin should benefit when trust in fiat currencies, banks, or political stability falls. But liquidation data tells a much narrower story: positioning, not conviction. If the market is short during a risk shock, BTC could still rip toward ~$84,000 because shorts are being cleared, not because investors suddenly decided it is digital gold. Tradable? Sure. Durable? Different question. I would not blur those two.
The source gives liquidation thresholds, but it does not include extra commentary or trader reactions. There is no quoted reaction in the source, so adding one would bend the record. The stated figures are only two liquidation levels: more than $6,180,000,000 in shorts above roughly $84,000, and more than $3,650,000,000 above roughly $2,310. Everything else, including the BTC and ETH framing here, is market interpretation. Keep that line clean.
What this means
This setup shows a heavy concentration of bearish leverage on 28 May 2026. If the ~$84,000 level is BTC, Bitcoin’s next push higher could come less from fresh demand and more from short covering above a visible liquidation band. If the ~$2,310 level is ETH, Ethereum has a similar setup, though smaller. Is that overkill for one liquidation map? No. More than $3,650,000,000 in possible short liquidations is still large enough to change intraday behavior.
Traders should watch the ~$84,000 and ~$2,310 levels, then check whether CME open interest and funding rates back up the squeeze idea. Counter to the usual advice, the level itself is not the whole trade. The better tell is whether open interest stays elevated while funding rates start confirming pressure on shorts. The next macro date to keep on the calendar is the 17 June 2026 FOMC decision. Rates and dollar liquidity could decide whether forced buying turns into real BTC and ETH demand. Until then, my read is blunt: shorts are crowded, but liquidation fuel is not the same thing as a bull market.