


Short Term Bitcoin Holder Profit Hits Multi-Month High, Raising Correction Risk
Short term bitcoin holder profit is the unrealized gain sitting in wallets that bought BTC one to three months ago. CryptoQuant says this number has climbed to its highest level since June 2025. That reading usually shows up before pullbacks, because newer holders cash out fast the second their paper gains start feeling real.
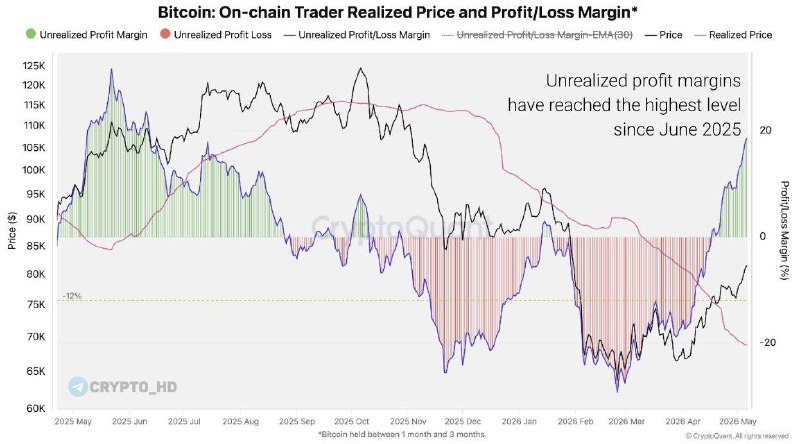
The data comes from CryptoQuant’s on-chain set tracking buyers from roughly the last one to three months. Unrealized profit for this group now sits at its highest mark in close to a year. Whenever this segment goes deep green, the supply overhang grows. Eventually that paper profit turns into actual sell pressure on the order book.
The macro picture is simple. Short term holders are the most reactive cohort on the Bitcoin network. They didn’t sit through a bear market, they don’t have years of conviction stacked up, and they react to every Fed headline and every CPI print. When this group is sitting on big gains, even a mild risk-off day in equities or one hawkish Powell sentence can flip them from holders to sellers inside a week. That is the dynamic that turned local tops into 10 to 15% pullbacks earlier this cycle.
The second angle is structural. This is where the bitcoin short term holder SOPR conversation starts. SOPR, the Spent Output Profit Ratio, measures whether coins moving on-chain are being sold at a profit or a loss. Per Glassnode’s framework, SOPR readings sustained above 1.0 for short term holders show active profit-taking. For the 1 to 3 month band, SOPR usually spikes alongside unrealized profit readings like the one CryptoQuant just flagged. Sustained readings above 1.0 have come before distribution phases where price stalls, chops sideways, then breaks lower before the next leg up.
This cohort does not move markets alone. They are not whales. But in aggregate they are big enough that when BTC short term holder selling kicks in at scale, it eats spot bids and forces longer term holders to defend levels they would rather not. That is how local tops form. Not one big seller. Thousands of recent buyers all reaching for the exit inside the same price band.
Elevated correction risk is not the same as an imminent crash. CryptoQuant’s framing is probabilistic. The metric matching June 2025 highs just means the conditions that usually precede a pullback are now in place. Whether the pullback actually shows up depends on macro catalysts, ETF flows, and whether spot demand can keep absorbing the short term profit-taking that is almost certainly already starting under the surface.
The data does not tell you how big the eventual move will be. Past episodes where short term holder unrealized profit hit comparable levels produced corrections ranging from a 6% shake-out to drawdowns over 20%. The variable was always external. A Fed surprise, an exchange blowing up, a geopolitical shock. The on-chain setup just primes the powder. Something else has to light it.
For traders, the practical read is about positioning, not panic. When short term bitcoin profit taking ramps up, leverage gets expensive fast. Funding rates climb, perp basis widens, and being wrong on direction starts costing real money. Historically the cleaner move in setups like this has been cutting leverage and waiting for SOPR to reset back toward 1.0 before adding risk. That reset is usually where the local bottom prints in most short term holder cycles.
Spot ETF flows are the wildcard worth watching. Per data from Farside Investors and SoSoValue, sustained net inflows into U.S. spot Bitcoin ETFs can absorb short term holder selling without much price damage. That is roughly what happened during several episodes earlier this year. If ETF flows turn neutral or negative while short term holders start distributing, the correction probability moves from elevated to high.
What this means
The signal applies specifically to BTC and the freshest layer of its holder base. Short term bitcoin holder profit at multi-month highs means the market has rallied hard enough and fast enough that recent buyers are sitting on real gains. Historically that condition resolves through some combination of sideways chop, a profit-taking flush, or a sharper correction before the next sustainable leg up. The level of the metric is not a sell signal on its own. It is a flag that the asymmetry of the trade has shifted, and that adding spot exposure here carries more downside risk than it did a month ago.
Two indicators are worth watching closely over the next two to three weeks. The bitcoin short term holder SOPR, and the realized price for the 1 to 3 month cohort. A sustained break of SOPR back below 1.0 would confirm the distribution phase is underway and the local top is in. Also watch U.S. spot ETF daily net flows. If they hold positive while short term holders distribute, expect a shallow correction or a sideways grind. If flows go negative at the same time, the setup tilts toward a deeper retrace. Per the CME FedWatch tool, market positioning around the next FOMC decision and any incoming macro print that shifts rate-cut expectations will be the most likely catalyst to convert this elevated risk into actual movement.