


Bitcoin price target: $100k by September? Double-bottom theory gets traders talking
A chart idea spreading through crypto circles says Bitcoin could move past $100,000 by September or October, based on a “double bottom” pattern. Big claim. My take: the chart is interesting, but the headline number is what is doing most of the emotional work here. If it plays out, BTC would be back near the levels that get traders loud again and give sidelined institutions a reason to look twice after months of choppy, range-bound action.
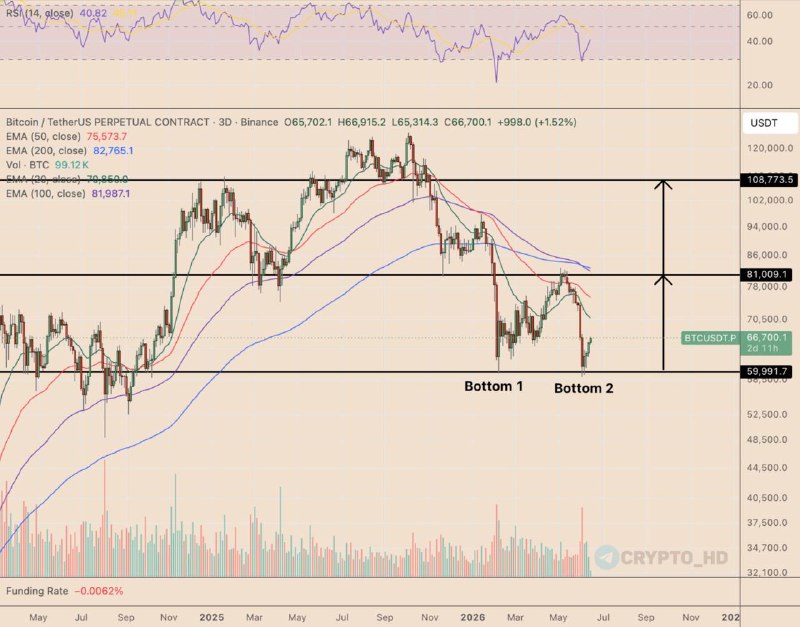
The “double bottom” theory, flagged by Crypto Headlines, points to a setup traders often treat as a bullish reversal. Sellers tried to push the price down twice. They failed both times. Buyers may now have more control. That is the read, at least. Most chart guides say this pattern is bullish. That is only half right. It is bullish only if volume confirms it and the second bounce does not turn into another weak relief rally. Why does this matter? Because a clean-looking pattern without follow-through is just bait for impatient dip buyers.
The $100,000 case also needs macro money flows to cooperate. Central banks are still wrestling with inflation, rate expectations, and the uncomfortable question of when policy finally eases. If the Federal Reserve sounds more dovish, BTC could attract investors looking beyond the usual risk assets. If inflation comes in hotter than expected, the same thing can happen for a different reason. Weird, but true. We have seen versions of that before: around major economic announcements, Bitcoin has sometimes moved 5% to 10% in a week. During the 2020 COVID stimulus period, BTC climbed sharply as investors worried about money printing and the long term value of fiat currencies.
Then there is the safe haven argument. I’ll be honest: I find this one messier than the chart case. Geopolitical tension, wars, sanctions, and sudden political shocks can push investors toward assets outside direct government control. Gold has owned that role for decades. Bitcoin is trying to take part of it because it is borderless and liquid. It is also easier to move than physical metal. Counter to the usual advice, the safe haven story does not need to be perfectly true to move price; it only needs enough traders to believe it for a few sessions. During the early Russia-Ukraine conflict, BTC saw a brief jump in volume and price, with some analysts linking a 3% to 5% move to safe haven demand. If global instability gets worse, that same demand could add fuel to the double-bottom setup.
What this means
If the double-bottom setup holds, it would suggest Bitcoin has already absorbed a lot of recent selling. That does not promise a clean breakout. Crypto rarely gives anyone a clean anything. My bias here is simple: confirmation matters more than the pattern name. The market may be moving out of sideways consolidation and into a stronger upward trend, but traders still need to watch volume, resistance, and whether buyers defend pullbacks instead of letting the chart roll over again.
The big level to watch is $70,000. A sustained break above that area would make the $100,000 September-October target look less like a moonshot and more like an actual trade. Is this overkill for one chart pattern? No, because rate expectations still drive risk appetite across markets, and the next FOMC meeting sits right in that path. CME Bitcoin futures data can show whether larger players are adding exposure, especially through open interest. Geopolitical headlines matter as well. Yes, this slightly contradicts the caution above; bear with me. A sudden escalation could revive the digital safe haven trade quickly, even if that story still feels a little too tidy for my taste.