


Bitcoin drops to $74,300 as spot ETFs shed $2.26 billion in two weeks
Bitcoin’s drop to $74,300, paired with ugly outflows from spot exchange traded funds, dents the clean ETF support story. For months, the shortcut was simple: ETF demand buys the dip. I’ll be honest: that read now looks too tidy. The floor is not gone, but it is wobbling.
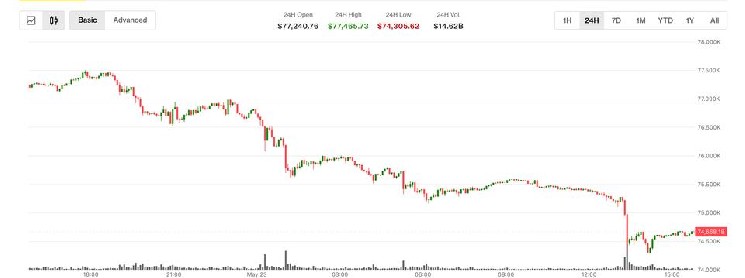
BTC fell to $74,305 early Saturday, its lowest level since April 20, as higher U.S. Treasury yields and developed market bond yields pulled money away from risky assets that do not pay income. CoinDesk data cited in the source report showed BTC down more than 3% over the past 24 hours and about 10% below its recent high above $82,500 on May 6. The rough part is not only the price. This is not just another weekend wobble. It is happening while ETFs are seeing real redemptions, not merely a derivatives flush.
Investors pulled $1.26 billion from U.S. spot Bitcoin ETFs this week, the biggest weekly outflow since January. Roughly $1 billion left the same products the week before. That puts the two week loss above $2.26 billion. For a market that had treated spot ETFs as a steady bid under BTC, that is not a footnote. It is the reset.
Macro is doing plenty of the damage. When U.S. Treasury yields rise, speculative assets have to argue harder for a place in portfolios. Bitcoin does not pay a coupon. It does not issue a dividend. It does not carry a government guarantee. Why does this matter? Because if investors can earn more from government bonds with less risk, BTC has to compete on conviction alone. Simple, and painful.
That is the trader problem now. BTC at $74,305 is up against higher developed market bond yields and a broader move away from assets that pay nothing. Most bullish ETF takes implied the new wrapper would smooth out the cycle. That’s only half right. If spot ETF buyers step back while yields keep climbing, Bitcoin loses one of the clearest demand signals from the last cycle, and the 10% slide from the May 6 high above $82,500 starts to look less like noise and more like a warning.
The safe haven argument also looks messier than its loudest supporters want to admit. The source report points to strong speculative flows into commodities such as oil, copper, and sulfur, as markets price possible supply disruptions through the Strait of Hormuz tied to the Iran conflict. My take: that detail matters more than the usual crypto-versus-gold debate. In this setup, BTC is not acting like an automatic crisis hedge. Money is moving toward assets with direct supply risk. Not just toward politically neutral digital scarcity.
That does not kill the safe haven case for Bitcoin. It narrows it. Yes, this slightly contradicts the neat “BTC failed as a hedge” line, but bear with me. In a geopolitical shock, traders still have to decide whether BTC behaves more like gold, more like Nasdaq risk, more like a liquidity release valve, or just like whatever can be sold quickly. Right now, the numbers lean toward risk asset behavior: BTC is down more than 3% in 24 hours, ETF outflows are above $2.26 billion over two weeks, and commodity linked trades are pulling in speculative money.
The source report also mentions another possibility: some capital may be moving toward SpaceX’s expected IPO. Blockchain based pre-market derivatives tied to that event have already seen millions in trading volume on blockchain based platforms. That is only a theory, not a confirmed driver. Still, it fits the tape. Traders may not be done speculating. They may just be chasing a different trade. We have seen that rotation before in hot markets: the risk does not disappear, it migrates.
For BTC, that distinction matters. A market selling Bitcoin to buy government bonds is getting defensive. A market selling Bitcoin to chase oil, copper, sulfur, or SpaceX-linked pre-market derivatives is rotating risk. Is that difference academic? No, because both can hit the spot price in the short run, but they imply different trader psychology. One looks like fear. The other looks like opportunity cost.
The ETF channel is still the cleanest signal here. Spot Bitcoin ETFs were supposed to broaden the buyer base and make BTC less dependent on crypto native leverage. They may still do that over time. Counter to the usual advice, though, “follow the flows” is not enough unless traders also watch yields. When U.S.-listed products lose $1.26 billion in one week, after roughly $1 billion the week before, ETF demand should not be treated like a guaranteed one way institutional ramp.
BTC now has a blunt problem: it needs fresh demand to offset redemptions, rising yields, and competing macro trades. The $74,305 print is close enough to $74,300 to matter psychologically, and April 20 now marks the last time Bitcoin traded this low. We would watch that zone closely. If it breaks cleanly, the market will start asking whether the May 6 high above $82,500 was a local top, not just a pause.
What this means
Bitcoin’s ETF era looks more cyclical than the early bullish pitch suggested. No magic bid.
BTC is still the main ticker under pressure, with $74,305 and the wider $74,300 area now acting as the market’s stress line. The trade is no longer as simple as “ETFs bullish.” It depends on ETF flows, Treasury yields, bond market pressure, geopolitical demand for commodities, and whether speculative capital finds shinier trades elsewhere. That is a tougher mix. Less room for lazy optimism.
The next U.S. trading session after Saturday, May 23, matters. Traders will watch whether spot Bitcoin ETF outflows grow beyond the current $2.26 billion two week bleed. They will also watch how BTC trades around $74,305 and how far it sits below the May 6 high above $82,500. If redemptions slow and BTC holds the April 20 low zone, bulls can argue the selling is close to exhaustion. If outflows continue and yields stay high, the next move will probably come from macro sellers, not crypto optimists.