
















































Bitcoin Tops $65,500 as $209 Million in Crypto Shorts Collapse Across Markets
Bitcoin pushed past $65,500 on Wednesday, July 17, 2024, and short sellers got hit hard. Across crypto, about $209 million in short positions were liquidated. The cleaner excuse was the softer than expected U.S. PPI report. My take: one inflation print does not change the whole market. Traders still acted like they had been waiting for permission.
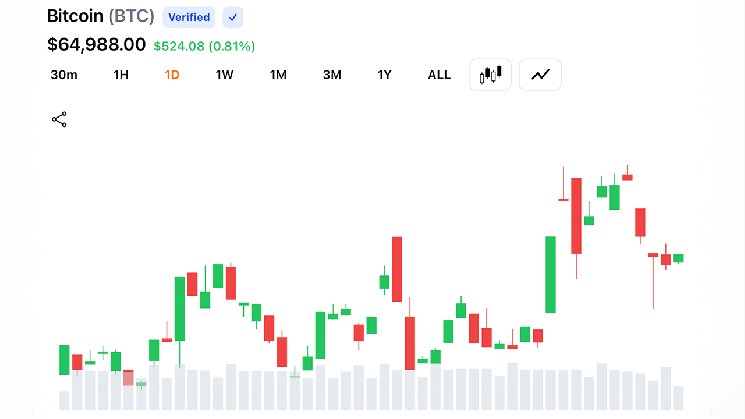
Bitcoin moved back above $65,000 after recovering Monday’s losses. The jump followed the U.S. producer price index report, which came after Tuesday’s CPI release and showed prices down 0.3% from the previous month. Analysts had expected prices to stay flat. Markets noticed the miss immediately. No mystery there.
Before testing levels last seen on June 22, Bitcoin spent late Tuesday and early Wednesday boxed in between $64,500 and $65,000. Then that range broke. Just after 8 a.m. EST, buyers pushed Bitcoin to an intraday high of $65,518. By 12:45 p.m. EST, it had slipped back to a little above $64,800, still slightly higher over 24 hours. The move above $65,500 briefly put Bitcoin’s market cap above $1.3 trillion and left it up about 10% for the month. It was still roughly 3% below its June 16 level near $67,000. That level still matters.
Derivatives desks took most of the damage. More than $58 million in leveraged Bitcoin trades were wiped out. Shorts were nearly 85% of that total. Across crypto, liquidations hit $324 million, including $209 million in shorts. Most market recaps treat that as clean bullish confirmation. That’s only half right. A squeeze can make a move look cleaner than it is, because forced buying can clear the way for a while without proving that spot demand is strong enough to carry the whole rally.
The softer CPI and PPI numbers changed the rate conversation fast. Odds of a Federal Reserve rate hike at the next meeting fell from just over 40% earlier in the week to 12%. That is a real repricing. Why does this matter? Because Bitcoin tends to like less rate pressure, or at least no new pressure, after higher yields spent months limiting risk assets since May. The DXY was near 100.77, its weakest level in months, while the 10-year yield slipped to 4.57% after touching 4.61% before the CPI print. A weaker dollar usually helps speculative assets. Lower yields help too. Crypto reacted right on cue.
The Middle East was still dominating headlines, but Bitcoin did not trade like panic was driving the market. Nicolai Sondergaard, a research analyst at Nansen, said spot Bitcoin and Ether ETF inflows on July 15 showed that Tuesday’s CPI print had changed the short term macro outlook. Headline inflation slowed to 3.5% year over year, below the 3.8% consensus, while core inflation cooled to 2.6% against a 2.9% forecast. Nansen data also showed exchange outflows holding up despite the geopolitical stress, so buyers were still taking supply off the market. I’ll be honest: the Iran blockade headline and the oil jump, with WTI up about 14.6% in five days, looked like they should have mattered more. They did not break the pattern. For now, inflation and liquidity seem to matter more than the hedge against chaos pitch. On-chain data says something similar: the wallets that usually move early in these setups have not shifted hard into stablecoins.
Sondergaard also noted that funding is close to zero. That matters because the market does not look packed with overleveraged longs waiting to get flushed. MVRV sits at 1.205, realized price is around $53,000, and the long term holder cost basis is near $49,900. Those levels give traders a rough floor to watch. Counter to the usual advice, I would not read this first as a geopolitical fear trade. It looks more like a market reacting to inflation data, rates, and liquidity.
What this means
Bitcoin’s move was pretty straightforward: inflation cooled and shorts got trapped. Price jumped. Right now, traders seem more focused on rates than on geopolitical headlines. The $209 million in crypto short liquidations shows how many people were leaning the wrong way when the data landed. Is that bullish? Yes, but only in the short term. It can clear resistance quickly. It can also make everyone a little too sure of themselves.
The next date to watch is the FOMC meeting on July 28 and 29. If inflation keeps cooling and the Fed sounds open to a real pause, ETF inflows have a better setup. Yes, this slightly cuts against the caution above. Bear with me. If officials signal that rate hikes are off the table, or even hint at cuts later, Bitcoin could make another run at the June 16 level near $67,000. That is the first line I would watch. A clean break above it would make the bullish case harder to brush off.