


Bitcoin vs Dow Jones Setup Puts $400,000 BTC in Focus
A bitcoin vs Dow Jones comparison asks a strange but useful question: is bitcoin starting to move like a major stock index did during an earlier bull phase? One market post says yes, or at least close enough to notice. It reads BTC’s current chart against the Dow Jones through Elliott Wave analysis and floats a move toward roughly $400,000. Big number. Loud headline. My take: useful chart work, dangerous if treated like prophecy. Traders usually use Elliott Wave as a map, not a contract. If enough people started taking a $400,000 bitcoin price prediction seriously, crypto risk appetite would not drift higher. It would probably snap higher.
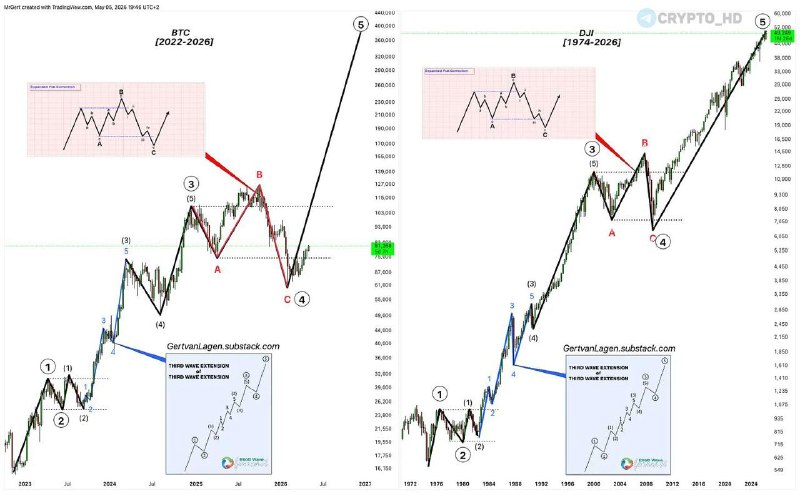
The claim is clean: BTC could reach about $400,000 if its current structure keeps tracking a Dow Jones-type move. The source gives one market idea and then leaves several blanks. It does not name the analyst. It does not show a chart date, list an exchange price, set a time horizon, give an entry zone, mark an invalidation level, or attach a probability. That matters more than the target. Why? Because without a timestamp or invalidation level, the Dow Jones Bitcoin comparison is better as a mood read than a trade setup. Most bullish chart posts imply precision. That is only half right. The fair read is narrower: the comparison points to a possible structure, but traders do not get enough detail to trade it cleanly.
From a macro-flow view, this sits inside the bitcoin vs stock market debate. BTC often behaves like a high beta liquidity asset when rates, inflation expectations, and dollar liquidity drive positioning. The Dow Jones comparison fits that risk-asset view better than the cleaner “digital gold” story. The Federal Reserve says FOMC decisions guide U.S. monetary policy, which is why bitcoin traders still watch rate expectations and liquidity around major Fed meetings. I’ll be honest: a $400,000 BTC target needs more than a tidy Elliott Wave count. It needs deep liquidity, steady spot demand, and a market that does not stack leverage so aggressively that forced selling chops the move apart.
The safe haven argument gets messier because the comparison is with a stock index, not gold. BTC bulls often say bitcoin should act like gold during political stress, banking stress, or currency debasement. But this post uses the Dow Jones as the mirror. That changes the read. It is not “BTC replaces safe haven assets tomorrow.” It is closer to “BTC may be copying a large equity-index expansion.” Counter to the usual advice, that actually weakens the pure safe haven case while strengthening the risk-asset case. The World Gold Council often discusses gold as a store of value and portfolio diversifier; this bitcoin setup is framed through stock market behavior. Still, if BTC really started moving toward $400,000, investors would reopen the safe haven debate immediately. Price rewrites narratives fast.
There is also an adoption angle, although the source does not name a company, country, ETF, bank, custody provider, or institutional buyer. Skip the hype. A six figure BTC target only feels believable to larger investors if the spot market has enough depth and the custody and access rails can handle bigger flows. The U.S. Securities and Exchange Commission has said spot bitcoin exchange traded products hold bitcoin and issue shares that trade on securities exchanges. That regulated access matters because institutional participation is not just a slogan; it is plumbing. In plain terms, the $400,000 level is not only about one chart pattern. It also depends on whether BTC can keep moving from speculative trade to portfolio asset.
No quote or named reaction appears in the source, so there is nothing solid to attribute. That needs to be said plainly. Crypto markets love chart-led narratives, and Elliott Wave targets spread fast because they give traders a clean number. Here, that number is $400,000. But the missing pieces are not small: no date, no entry zone, no invalidation level, no named analyst, no volume support, and no probability. Yes, this sounds like it undercuts the whole setup after describing it. It does. That is the point. A cleaner statement would be that the bitcoin price potential Dow Jones comparison is a bullish market narrative, not a confirmed forecast.
What this means
The bitcoin vs Dow Jones setup means traders are reading BTC as a risk asset that could follow an equity-index-style expansion, instead of treating it as just another isolated crypto chart. It also shows that bullish BTC positioning is leaning again on cross-market analogies, especially the bitcoin vs stock market frame. Is this overkill for one chart post? No, because a $400,000 target changes how traders talk about risk. If traders buy the Dow Jones comparison, BTC becomes the ticker to watch, with the psychological target near $400,000. That does not make the target inevitable. It means the market is testing whether bitcoin can trade like a long-duration liquidity asset with stock-index-style upside.
The practical takeaway is blunt: liquidity, leverage, and spot demand decide whether the $400,000 bitcoin price prediction stays alive. Watch how BTC trades around the next major macro dates, especially the next FOMC decision and the CME futures positioning update after it. That is where the chart idea meets actual money. CME Group says bitcoin futures are used to manage bitcoin price exposure, so futures positioning gives traders a useful read on leverage and institutional risk appetite. My take: the $400,000 headline is less important than whether BTC keeps making higher highs without breaking the Dow Jones Bitcoin structure behind the call.