


Bitcoin Market Cycle Psychology: Anger, Depression, and the Road to $100K
Crypto bulls on Twitter are passing around the “Wall St. Cheat Sheet” again. Their argument is blunt: Bitcoin (BTC) looks close to the “Anger/Depression” stretch of the cycle. The popular version says BTC may still need one ugly flush into the $40,000 to $50,000 range before it can make a cleaner run at $100,000 or higher in 2027 or 2028. My take: useful mood board, terrible GPS. Markets do not move in neat cartoon stages. Still, the chart gets one thing right about this moment. Traders sound tired, jumpy, suspicious, and weirdly eager to punish anyone who gets hopeful too early.
The “Wall St. Cheat Sheet” is a market psychology chart, not a model with predictive power. It maps the familiar emotional loop: disbelief, hope, optimism, belief, euphoria, then anxiety and denial. After that come panic, capitulation, anger, and depression. It is not science. It is not a trading system. Most guides treat it like a cycle clock. That is only half right. With BTC, the chart is better at describing crowd behavior than timing price. People panic. People chase. People swear they are done with crypto forever, then buy back higher six months later.
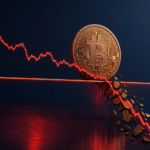
Through that lens, the “Anger/Depression” argument is not ridiculous. Risk assets have been hit by tighter Federal Reserve policy, sticky inflation, and higher rates; BTC never fully escaped that macro trade. The cleanest example is still the 2022 crash: Bitcoin fell from nearly $69,000 in November 2021 to under $16,000 by November 2022. That was not a normal cool-off. That was the part of the cycle where laser eyes disappeared and everyone suddenly remembered they had been “risk-managed” the whole time. I’ll be honest: that kind of revisionist confidence is usually a late-cycle smell. The current chop has some of the same texture, especially when good news barely moves the market. Low conviction. Plenty of doubt. A drop into the $40,000 to $50,000 area would match older support zones and could shake out buyers who only arrived for the easy part.
This phase also puts the “Bitcoin as safe haven” story under pressure. BTC gets called digital gold all the time, but its crisis behavior has been uneven. In the first days after Russia invaded Ukraine in February 2022, Bitcoin rose roughly 8%, then got pulled back into the wider market selloff as rates and inflation took over. Why does this matter? Because the hedge story works differently over days than it does over months. In a sudden crisis, some buyers may reach for BTC. Over a longer stretch, tight monetary policy can overpower the whole narrative. Counter to the usual advice, the question is not whether Bitcoin is “risk-on” or “risk-off” forever. The question is which force is dominating this specific tape.
If the cheat sheet read is right, investors are not treating Bitcoin as protection right now. They are thinking about losses they have not made back, gains they might miss, and whether the next rally is another trap. I keep coming back to that hesitation, because it shows up before the chart looks obvious. That kind of mood makes people sell late and then freeze when the setup starts improving. A move toward $100,000 in 2027 or 2028 would need more than ETF flows or institutional buying. It would also need stronger market structure, better liquidity, and traders who stop flinching every time BTC stalls. Simple idea. Hard trade.
What this means
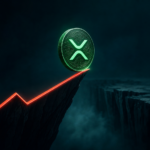
The short version: BTC could still have downside if this psychology read is right. The $40,000 to $50,000 range is the area people are watching. Longer term, the bullish case is still alive, but it asks for patience, which everyone claims to have until price drops 20%. Yes, this sounds like it contradicts the warning about treating the cheat sheet like GPS. Bear with me. Sentiment can be useful without being magic. In that model, anger and depression come before recovery. For traders, dips near that lower range may be accumulation spots, but only if the pattern holds. That is the catch. Worn out markets can drift lower than they “should.”
The next signals are basic, maybe annoyingly basic. Start with the Fed. If inflation keeps cooling and the Fed sounds less aggressive on rates, risk assets probably get room to breathe. If not, BTC may keep grinding. The $40,000 level matters too. A clean break below it would make the capitulation argument louder. Is this overkill for one psychology chart? No, because the level is where the story either gains pressure or starts to fall apart. A strong bounce from that area, especially with better macro data behind it, would suggest the market is starting to crawl out of the depression phase. The $100,000 target for 2027 or 2028 also fits the rough four-year halving rhythm, which is why bulls keep coming back to those dates. Possible, yes. Promised, no.