


Hedera (HBAR) price tightens near breakout as macro pressure builds
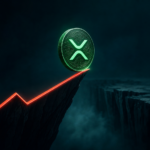
Hedera (HBAR) is pinned inside a tight range on the 15-minute chart, with a falling wedge starting to narrow. Neat chart. Messy backdrop. I’ll be honest: this is exactly the kind of setup that looks cleaner than it trades. Crypto is still taking cues from inflation worries, Fed comments, and Bitcoin’s next move, so HBAR does not get to behave like a standalone story.
HBAR has been stuck in a narrow band, with buyers and sellers crowding the same short term levels. At the time of writing, HBAR traded at $0.0801, inside a 24-hour range of $0.07801 to $0.0803. That is barely a move. The token was up 0.1% on the day, but zoom out and the tape still looks tired: down 2.4% over 7 days, 6.7% over 30 days, and about 39.9% over the past year. So yes, there is a small bounce today. My take: calling that a recovery is too generous.
On the chart, $0.0780 is still support, while rallies keep fading near $0.0803 to $0.0810. HBAR is boxed in. Volatility is drying up. Each small move higher runs into sellers, while dips toward $0.0780 keep pulling buyers back in. Why does this matter? Because repeated compression around the same levels usually means the next move can feel sudden, even if the setup has been visible for hours. Still, direction is not settled. It is just price tapping both walls of a narrow room.
On the 15-minute chart, HBAR is forming a falling wedge, with two downward-sloping lines moving closer together. The lower edge is near $0.0780, a level sellers have tested several times without getting a clean break. Each retest has produced a small rebound, which hints that selling pressure may be fading there. The upper edge sits around $0.0805 to $0.0815, where price has been rejected more than once. Most guides treat a falling wedge as a bullish reversal pattern. That is only half right. The pattern helps define risk, but it does not force buyers to show up.
The chart setup matters, but macro pressure still has more say in crypto right now. Interest rate expectations remain a problem for risk assets, and HBAR is not exempt. Hotter inflation data or tougher Fed language could push traders out of altcoins quickly. Bitcoin has also struggled to hold a clean move above $70,000, which tells me risk appetite is still cautious, not broken, but cautious. If BTC makes a strong move either way, altcoins usually follow. A Bitcoin drop toward $60,000, for example, could wreck HBAR’s wedge setup before it gets a chance to work.
Regulation is another weight on sentiment. Hedera has an enterprise angle, but HBAR still trades inside the wider crypto market. That market reacts fast to SEC pressure, enforcement news, exchange headlines, and token-listing risk. Spot Ethereum ETF approval could bring fresh money into crypto and help lift altcoins, including HBAR. Bad regulatory news could do the opposite, especially if it hits staking or exchanges. Yes, that slightly contradicts the clean chart narrative above. Bear with me: HBAR needs more than a technical break. It needs the market around it to stop flinching.
What this means
For HBAR, the main levels are $0.0815 above and $0.0780 below. A clean move above wedge resistance near $0.0815 would be the first useful sign of a bullish rebound. If buyers can hold that move, the next short term area to watch is $0.0830, then $0.0840 to $0.0850. That would show buyers finally gaining control after weeks of weak price action. A break below $0.0780 says something very different. Skip the optimism there. It would weaken the wedge setup and expose lower liquidity areas, with HBAR still trapped in its broader bearish consolidation.
Traders should watch for a real break above $0.0815 or a clean loss of $0.0780. Everything between those levels is mostly noise. Is that too blunt? Maybe, but cramped ranges often punish over-reading. Inflation data, Federal Reserve comments, and Bitcoin’s next major move will matter about as much as HBAR’s own chart. If BTC can hold above $72,000, altcoins may get room to breathe. If it slides below $60,000, HBAR probably follows the market lower, no matter how clean the wedge looks. We have seen this setup before in weak altcoin tape: the chart can be right, and the trade can still fail. The next few days matter because the pattern is running out of room, and tight charts usually do not stay quiet for long.