















































XRP’s $7 Target Still in Play: Technicals Point to a Possible Breakout
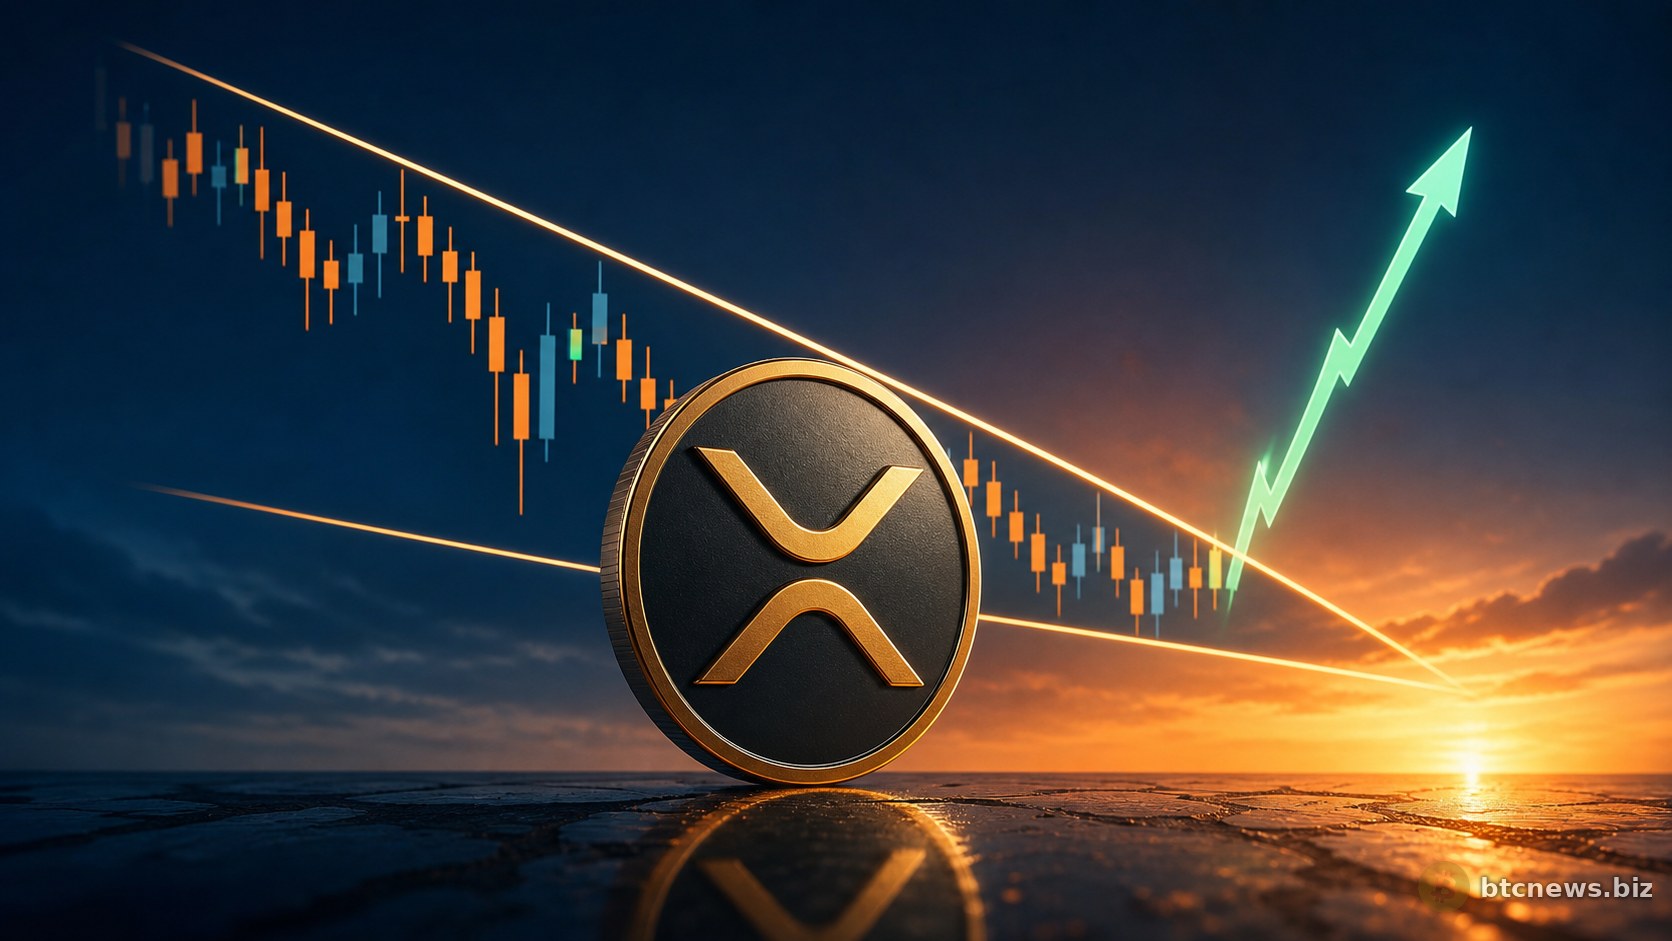
XRP has been hit hard. The chart, though, has not actually cracked. It is still above the major Fibonacci retracement levels and still trapped inside a descending wedge. Why does this matter? Because XRP has broken out of this kind of structure before, and when it runs, it rarely drifts upward in a neat, polite way.
XRP has been under pressure, falling to around $1.10 after losing a little over 5% in a week. Still, the weekly chart has not lost its main support area. My take: that is the detail people are underpricing. The token is sitting at a level that could shape the rest of 2026. Buyers defend it, and the bullish case stays alive. Buyers lose it, and the $7 call starts looking more like wishful chart work.
Much of the bullish case comes from the Fibonacci retracement map. XRP has stayed above the 0.382 retracement level at $1.05, which has worked as support before. The broader Fibonacci grid runs from a cycle low near $0.50 to upside targets above $11, and XRP has reacted around these levels often enough that traders are still watching them. Standard technical analysis says the long term bullish trend holds as long as XRP stays above the 0.382 retracement. That is only half right. It gives bulls a cleaner argument, yes, but it does not protect the setup from a market-wide flush when Bitcoin (BTC) or Ethereum (ETH) stumble, like BTC’s 8% drop in early May 2024 after hawkish Fed comments. Nothing in crypto is bulletproof. Especially not this.
That support also sits inside a wider demand zone, roughly $0.79 to $1.05. If XRP keeps closing above that range on the weekly chart, buyers still have a case, even after the recent weakness. I’ll be honest: the November 2024 comparison is the part I keep coming back to. Back then, XRP spent months inside a descending wedge before breaking out and climbing more than 500% in about a month. The current chart has a similar shape. XRP is again trading inside a descending wedge. Support is building slowly. Price is getting close to the wedge apex. Is that enough by itself? No. But when the range starts running out of room, altcoin traders tend to pay attention, especially in a market still taking most of its cues from Bitcoin, which briefly touched $61.4K in late April before bouncing slightly.
If the previous rally is used as a rough guide, the next major target sits near the 1.414 Fibonacci extension at about $7.88. That keeps the often discussed $7 target within reach, assuming XRP breaks out in a similar way. Fibonacci is not the only signal here, and I would not treat it like one. A long term ascending trendline that has supported XRP since 2023 now meets the broader demand zone near the current price. At the same time, descending resistance is squeezing price into a tighter range. Counter to the usual advice, this is not automatically bullish just because several levels meet in one area. It can break hard either way. The current zone matters because horizontal support, Fibonacci levels, and the long term trendline all meet there. For now, $1.06 is the level I would watch most closely. Holding above it keeps the bullish structure alive and improves the odds of a break above descending resistance instead of another move lower. The bullish case is still there, but it has to deal with regulatory pressure too, including the SEC vs. Ripple case, which continues to weigh on the asset and institutional confidence.
What this means
The chart still gives XRP a path toward $7, but it is not a free pass. This is the whole trade, stripped down: buyers need to keep defending the $1.06 area and then force a break from the descending wedge. Macro pressure still matters. Inflation data and Fed rate expectations can pull the market around. So can Bitcoin’s direction. Above $1.06, XRP still has a bullish setup. Below it, the setup starts to look tired.
The next thing to watch is a breakout from the descending wedge. If XRP clears that resistance, the 1.414 Fibonacci extension near $7.88 becomes the first major upside target. After that, the 1.618 extension near $11.74 comes into view. Weekly closes above $1.06 matter. So does volume. A breakout without strong volume would feel shaky, at least to me. Yes, this sounds like it contradicts the bullish setup above. It does not. It just means the chart has potential, but confirmation still has to show up. The next few months should show whether buyers have enough strength to turn this setup into a real move, or whether $7 stays another chart target people keep passing around.