


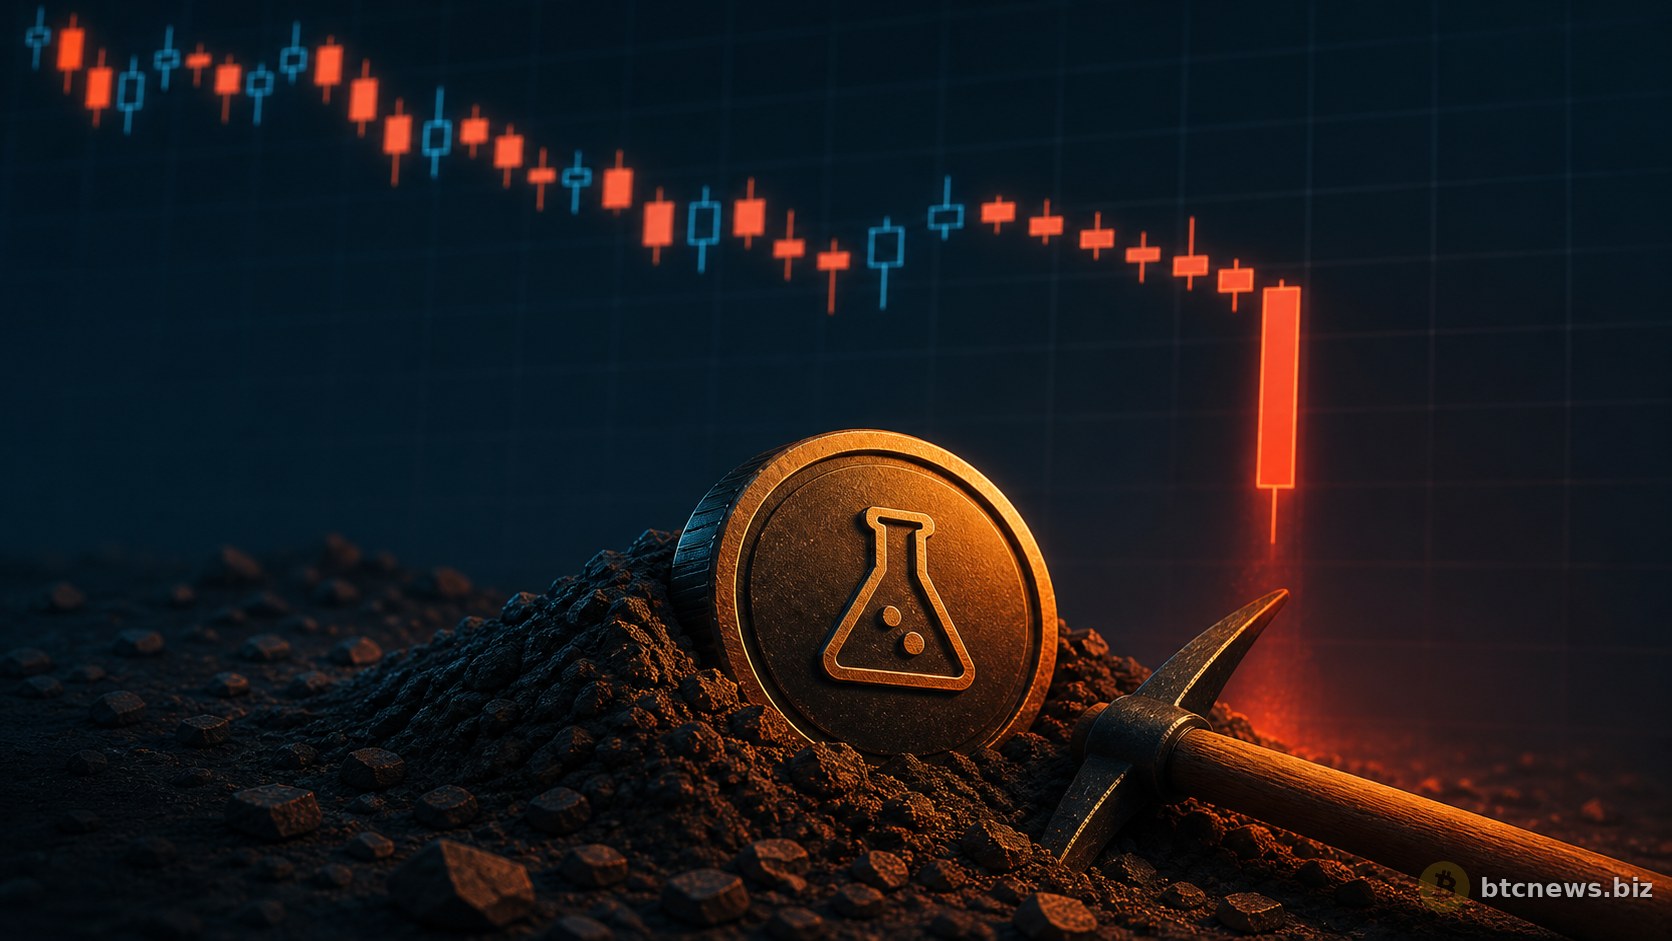
LAB Drops 21% as Traders Crowd the Short Side
“LAB fell 21.6% to $12.09 in the past 24 hours, while trading volume dropped 23.06% to about $50 million.” That is a hard move, not market noise. Price fell, volume thinned out, and Binance positioning shows traders leaning heavily against the token. For a mid-cap altcoin, that combination can turn ugly quickly, especially when nearby support starts to wobble.

“The drop in $LAB came after it failed to hold higher prices earlier this month, when it moved toward a major resistance area but could not stay there.” Buyers kept the token above support for a while. Barely. After the rejection, though, the chart started to look worn out. Lower price with lower volume usually says people are less willing to step in after the last push failed.
“Binance derivatives data shows a bearish lean, with 28.69% of top trader positions long and 71.31% short, leaving the Long/Short Ratio at 0.40.” That is lopsided. Traders often read this setup as a sign that larger or more active accounts expect more downside. I would not call it guaranteed capitulation, because crypto has a habit of embarrassing anyone who sounds too sure. Still, the signal is hard to ignore. After a failed breakout, heavy short interest can add pressure. $LAB is not BTC or ETH, but mood spreads fast in smaller tokens. When one speculative name gets hit, other mid-cap altcoins start looking shaky too.
“The rejection at the $17.78 resistance area mattered for $LAB, and the price later moved back toward $12.44.” That level had already stopped the token before, so another failure there gave sellers a clean target. Price is still above the larger support area near $9.15, which keeps the chart from looking fully broken. The RSI is calmer than the price move, sitting at 54.53 with its moving average at 56.28. Put simply, momentum is not flashing panic yet. It is stuck in an uncomfortable middle zone.
That is the awkward part. A neutral RSI can make the chart look calmer than the positioning data feels. Leveraged traders can move short term price action before the indicator catches up. We have seen versions of this before, including with Solana ($SOL) in late 2022, when short pressure often appeared before the cleaner technical signals. Different asset, different setup, same basic lesson: sentiment can run ahead of the chart.
“Even with heavy short positioning, $LAB’s OI-weighted funding rate stayed positive at 0.0127%, meaning long traders are still paying to keep their positions open.” That is the strange part. If most top traders are short, why are longs still paying a premium? One answer is that some traders still expect a bounce, maybe even a short squeeze. Maybe they are right. Maybe they are just early, which in crypto often feels exactly like being wrong.
The funding rate has cooled from earlier spikes, so bullish confidence is weaker than it was. Positive funding with bearish price action usually means the market is split. Some traders are still hanging on. Others have already gone defensive. With volume falling, that hope can disappear fast if buyers do not show up.
Macro does not help. If the Fed keeps rates higher for longer, risk assets tend to struggle, and smaller altcoins usually take the hit first. A token that failed at resistance, lost more than 20% in a day, and now has heavy short interest is in a rough spot. This is partly about $LAB. It is also about whether traders still want risk when the wider backdrop feels tight.
What this means
“The heavy short positioning on $LAB, even while the token holds above recent lows, shows how bearish traders have become after the failed resistance break.” The point is simple: failed breakouts are being punished. When risk appetite is weak, traders do not give altcoins much room to slip. The split between positive funding and heavy shorts shows a market stuck between hope and caution. Right now, caution is louder.
For $LAB, the $9.15 support area matters. A clear break below it would make the bearish case stronger and could bring another round of selling. If buyers can push price back toward $17.78, then the crowded short side becomes a problem for sellers. A squeeze is possible, but it needs real buying behind it, not just traders hoping the setup flips.
“Traders should watch $9.15 on the downside and $17.78 on the upside, since those levels now frame the next major move.” I would also watch derivatives data on other altcoins sitting near support or resistance. Funding rates, long/short ratios, and volume are not magic, but they show where traders have put real money. Over the next few weeks, macro data and any shift in the Fed’s tone could decide whether this risk-off mood gets worse or finally eases.